ISYS3374 - Business Analytics Assignment - RMIT University, Australia
ARE YOU LOOKING FOR RELIABLE ISYS3374 - BUSINESS ANALYTICS ASSIGNMENT HELP SERVICES? EXPERTSMINDS.COM IS RIGHT CHOICE AS YOUR STUDY PARTNER!
SECTION A: DISCUSSION QUESTIONS
1 - Explain the confusion matrix in classification methods and provide an example on how you interpret the its number?
A confusion matrix was normally used to summarize the classification algorithm performance. When we have unequal number of samples for different categories used (if more than two categories were present), then classification accuracy value will mislead the results and thus, we need a confusion matrix to get a true accuracy predictions
2 - Give two practical examples on applications of classification methods in your discipline. Provide detail explanations. You need to explain why you think classification can be used in those cases, you do not need to provide data or solve them.
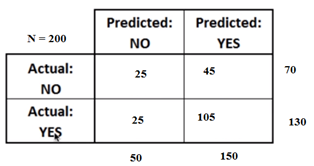
Example 1: In confusion matrix, there are two predictions that seems to be possible, namely "Yes" and "No". In medical terminologies, if we are interested in finding whether the patient has a disease or not, we code presence of disease as "Yes" and absence of disease as "No". let us consider a situation where 200 patients tested for a certain kind of disease. Out of those 200 cases, the classifier identified "Yes" cases 150 times and "No" cases 50 times. But in real time situations, 130 patients identified as cases and 70 do not.
Example 2: Let us consider the situation of identifying vegetarians in a certain population. For this study, a random sample of 100 respondents were taken from a supermarket. Their actual and predicted vegetarian information is given below.
3 - Give two examples related to your discipline that you need to apply over sampling partitioning before building the model. You need to provide detail explanations.
The method of partitioning was normally used when there is very low success percentage for the output variable. The major problem in the field of data mining is dealing with imbalanced data and also the machine learning too has to face the problem of imbalanced data. Few strategies will eventually help the researcher to overcome this problem and are termed as under sampling, feature selection and even we can use oversampling technique.
For example, looking for a customer who should be willing to participate in a short survey after the customer care call. Another example would be looking for a customer in a shopping mall to participate in a survey after their shopping time.
4 - Assume one of the explanatory variable (named X1) in your logistic regression is a categorical variable with the following levels: low, average and high, and another explanatory variable (named X2) is also categorical with the following levels: Sydney, Melbourne and Brisbane. Explain how you will use them in developing your logistic regression model. How many coefficients you will have in your final model?
For the first variable (named X1), there are three categories and therefore, two coefficients can be constructed (keeping low as reference, we can find the risk for average and high)
For the second variable (named X2), there are three categories and therefore, two coefficients can be constructed (keeping Sydney as reference, we can find the risk for Melbourne and Brisbane)
SAVE YOUR HIGHER GRADE WITH ACQUIRING ISYS3374 - BUSINESS ANALYTICS ASSIGNMENT HELP & QUALITY HOMEWORK WRITING SERVICES OF EXPERTSMINDS.COM!
SECTION B: QUANTITATIVE QUESTIONS
5 - There are 500 client records in the first worksheet of the Excel file (provided for this assessment) who have shopped many special products from an e-Business website. Each record includes data on types of product purchased (between 1-5), purchase amount ($), age, gender, family size of the customer, whether the client has a membership and whether the customer has a discount card.
a) Explain the steps on how to develop a KNN model to predict which customers will spend more than $1000. (Write your answer as: Step 1-... Step 2- ... and so on. You don't need to run XLMiner and report the results.)
The following steps needs to be performed in XL Miner to run KNN model
- Divide the data into 60% training data and 40% test data. This can be done in data partitioning section.
- Now select Data Mining tab → Partition - Standard Partition dialog.
- Select the cell which helps to Data_Partition worksheet.
- Now, go to Data Mining tab → Predict - k-Nearest Neighbors → k-Nearest Neighbors Prediction.
- At Output Variable, select output variable, and from the Selected Variables list, select the remaining variables.
b) Develop a predictive model to predict the spend amount of a new female customer with age of 28 who is living in a family with size 3 and is not a member and hold a discount card type 3.
The regression model is given below
SUMMARY OUTPUT
|
Regression Statistics
|
|
Multiple R
|
0.149
|
|
R Square
|
0.022
|
|
Adjusted R Square
|
0.012
|
|
Standard Error
|
293.360
|
|
Observations
|
500
|
ANOVA
|
df
|
SS
|
MS
|
F
|
Significance F
|
|
Regression
|
5
|
965950.07
|
193190.01
|
2.24
|
0.05
|
|
Residual
|
494
|
42513649.47
|
86060.02
|
|
|
|
Total
|
499
|
43479599.5
|
|
|
|
|
Coefficients
|
Standard Error
|
t Stat
|
P-value
|
Lower 95%
|
Upper 95%
|
Lower 95.0%
|
Upper 95.0%
|
|
Intercept
|
1212.48
|
51.34
|
23.62
|
0.00
|
1111.61
|
1313.35
|
1111.609
|
1313.346
|
|
Age (blanks means we do not know their age)
|
0.93
|
0.75
|
1.24
|
0.22
|
-0.55
|
2.40
|
-0.54739
|
2.400101
|
|
Gender (Male is 1)
|
-10.45
|
26.31
|
-0.40
|
0.69
|
-62.14
|
41.25
|
-62.1407
|
41.24691
|
|
Family size
|
-5.75
|
7.64
|
-0.75
|
0.45
|
-20.77
|
9.27
|
-20.7725
|
9.267125
|
|
Membership (with membership is 1)
|
2.71
|
26.32
|
0.10
|
0.92
|
-49.01
|
54.43
|
-49.0124
|
54.43061
|
|
Discount card type (0 means no card and there are three discount cards
|
-35.70
|
12.08
|
-2.96
|
0.00
|
-59.44
|
-11.97
|
-59.4412
|
-11.9676
|
From the above output, we have
Amount = 1212.48 + 0.93 * Age - 10.45 * Male - 5.75 * Family Size + 2.71 * Membership - 35.71 * Discount
In order to predict the spend amount of a new female customer with age of 28 who is living in a family with size 3 and is not a member and hold a discount card type 3, we have
Amount = 1212.48 + 0.93 * 28 - 10.45 * 0 - 5.75 * 3 + 2.71 * 0 - 35.71 * 3 = 1114.044
Thus, the predicted amount spent is $ 1114.044
DO YOU WANT TO EXCEL IN ISYS3374 - BUSINESS ANALYTICS ASSIGNMENT? HIRE TRUSTED TUTORS FROM EXPERTSMINDS AND ACHIEVE SUCCESS!
6 - A company provides maintenance service for washing machines in Victoria. The collected data are presented in the Excel file (second worksheet).
a) Assume the manager asked you to analyse the data and provide him some insights and recommendations. The report should not exceed 2 pages.
The main objective of the study is to determine the maintenance service for washing machines in Victoria. For the purpose of this study, a random sample of 90 respondent's opinion was taken into consideration. The descriptive statistics is given below.
|
Repair time (hours)
|
Months since last service
|
|
Average
|
11.199
|
5.611
|
|
Standard Deviation
|
4.609
|
2.783
|
|
Median
|
10.15
|
6
|
|
I Quartile
|
8.275
|
3.75
|
|
III Quartile
|
14.175
|
8
|
|
Minimum
|
0.5
|
1
|
|
Maximum
|
21.9
|
10
|
|
Sample Size
|
90
|
90
|
The mean repair time is 11.2 hours with a standard deviation of 4.61 hours and the median repair time is 10.15 hours. This indicates that nearly 50% of the sample data repair time fall below 10.15 hours and nearly 50% of the sample data repair time fall above 10.15 hours. The recorded minimum and maximum recorded repair time is 0.5 hours and 21.9 hours respectively
The mean months since last service is 5.611 months with a standard deviation of 2.783 months and the median months since last service is 6 months. This indicates that nearly 50% of the sample data months since last service fall below 6 months and nearly 50% of the sample data months since last service fall above 6 months. The recorded minimum and maximum recorded months since last service is one month and 10 months respectively.
Regarding the time of service, it is seen that about 54.8% of them used morning time to register their service and 45.2% of them used afternoon time to register their service.
Regarding the type of repair, it is seen that about 51.1% of the repair classified as electrical and 48.9% of the repair were classified as mechanical type.
Regarding the person used for service, it is seen that about 11.2% of the repair was done by James, 44.4% of the repair was performed by John and 44.4% of the repair was performed by Bob.
b) Build a model to predict the repair time for a future booking service than needs to be done by John and it is an Electrical repair. Do you suggest this service to be assigned to the morning shift or afternoon shift?
The regression model to predict the repair time is given below
SUMMARY OUTPUT
|
Regression Statistics
|
|
Multiple R
|
0.137
|
|
R Square
|
0.019
|
|
Adjusted R Square
|
-0.018
|
|
Standard Error
|
4.534
|
|
Observations
|
84
|
ANOVA
|
|
df
|
SS
|
MS
|
F
|
Significance F
|
|
Regression
|
3
|
31.3891
|
10.4630
|
0.5090
|
0.6772
|
|
Residual
|
80
|
1644.3933
|
20.5549
|
|
|
|
Total
|
83
|
1675.7824
|
|
|
|
|
Coefficients
|
Standard Error
|
t Stat
|
P-value
|
Lower 95%
|
Upper 95%
|
|
Intercept
|
12.484
|
1.364
|
9.151
|
0.000
|
9.769
|
15.199
|
|
Months since last service
|
-0.167
|
0.183
|
-0.913
|
0.364
|
-0.531
|
0.197
|
|
Time of service
|
-0.198
|
1.007
|
-0.197
|
0.844
|
-2.203
|
1.806
|
|
Type of repair
|
-0.788
|
0.993
|
-0.794
|
0.429
|
-2.764
|
1.187
|
The regression output is given below
Repair Time = 12.484 - 0.167 * Last Service - 0.198 * Afternoon - 0.788 * Mechanical
Here, the repair time is less when the time of service is afternoon time, so, I would recommend to service during the morning time as the repair person takes more time to concentrate on the type and severity of the repairs and does the job perfectly.
EXPERTSMINDS.COM ACCEPTS INSTANT AND SHORT DEADLINES ORDER FOR ISYS3374 - BUSINESS ANALYTICS ASSIGNMENT - ORDER TODAY FOR EXCELLENCE!
c) What other data you recommend to the manger to be added into this dataset in future for better analysis and what kind of analysis you think will be useful based on them.
The experience of the repair person which definitely explains about his repair time. Therefore, that variable can be included in the future analysis
7 - In worksheet 3, a dataset from blood bank is presented. The data are recorded for apheresis blood donation made by a group of donors of a period of time. The donor ID is unique for each donor. A donor might have donated more than once in this period. At each donation, the blood total protein level of the donor has been recorded. Use the dataset to answer the following questions:
a) There are some missing values for blood type. Think how you can fill in the missing values. Explain your approach (step by step) and also apply your approach and try to fill the missing value as much as possible in. (save the results in an Excel worksheet in and name it Question 3 Part a.)
The following steps needs to be followed to fill the missing values
- The frequency distribution for blood type needs to be computed.
- The maximum frequency blood type has to be selected.
- The missing values should be replaced by using stratified sampling technique.
- Here, the missing values is 58, and therefore, we need to replace 58 missing blood types.
- The table given shows the information about the blood types that needs to be filled for the missing values calculated using stratified sampling.
|
Blood Type
|
Frequency
|
Samples to be allocated
|
|
O+
|
441
|
40
|
|
A+
|
37
|
3
|
|
AB+
|
30
|
3
|
|
B+
|
15
|
1
|
|
O-
|
32
|
3
|
|
A-
|
29
|
3
|
|
AB-
|
22
|
2
|
|
B-
|
36
|
3
|
|
Total
|
642
|
|
b) Calculate the average of total protein for each blood type. Explain your approach (step by step). Report them in a worksheet and name it Question 3 Part b.
Pivotal table was created to calculate the average of total protein for each blood type
|
Row Labels
|
Sample Size
|
Average
|
Minimum
|
Maximum
|
|
A-
|
32
|
7.1865625
|
4.79
|
9.16
|
|
A+
|
40
|
7.102
|
4.66
|
9.26
|
|
AB-
|
24
|
7.170416667
|
4.57
|
8.98
|
|
AB+
|
33
|
7.24
|
4.4
|
9.93
|
|
B-
|
39
|
7.426923077
|
5.31
|
10.62
|
|
B+
|
16
|
7.315
|
5.68
|
9.16
|
|
O-
|
35
|
7.154
|
4.46
|
10.93
|
|
O+
|
481
|
7.218440748
|
3.56
|
10.88
|
|
Grand Total
|
700
|
7.2203
|
3.56
|
10.93
|
NEVER LOSE YOUR CHANCE TO EXCEL IN ISYS3374 - BUSINESS ANALYTICS ASSIGNMENT - HIRE BEST QUALITY TUTOR FOR ASSIGNMENT HELP!
c) Calculate the range of total protein for each blood type. Explain your approach (steps by step). Report them in a worksheet and name it Question 3 Part c.
Pivotal table was created to calculate the average of total protein for each blood type
|
Row Labels
|
Sample Size
|
Average
|
Minimum
|
Maximum
|
|
A-
|
32
|
7.1865625
|
4.79
|
9.16
|
|
A+
|
40
|
7.102
|
4.66
|
9.26
|
|
AB-
|
24
|
7.170416667
|
4.57
|
8.98
|
|
AB+
|
33
|
7.24
|
4.4
|
9.93
|
|
B-
|
39
|
7.426923077
|
5.31
|
10.62
|
|
B+
|
16
|
7.315
|
5.68
|
9.16
|
|
O-
|
35
|
7.154
|
4.46
|
10.93
|
|
O+
|
481
|
7.218440748
|
3.56
|
10.88
|
|
Grand Total
|
700
|
7.2203
|
3.56
|
10.93
|
d) Is total protein declining by age?
Scatter plot was used to see whether there is any relationship between age and total protein
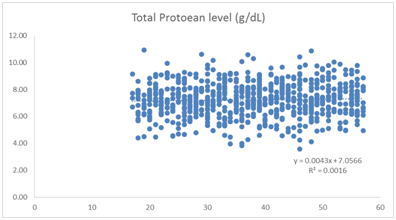
Going through the scatter plot, we see that there is no statistical evidence to show that total protein decline by age.
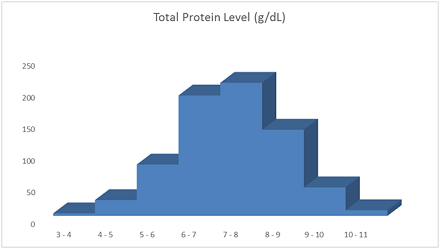
e) Present two best visualisation tool for this data that you think provide useful information?
Scatter Plot

Histogram
The data presented in worksheet 4 is the results of a 4-year study conducted to assess how age, weight, and gender influence the risk of diabetes. Risk is interpreted as the probability (times 100) that the patient will have diabetes over the next 4-year period.
ORDER NEW ISYS3374 - BUSINESS ANALYTICS ASSIGNMENT & GET 100% ORIGINAL SOLUTION AND QUALITY WRITTEN CONTENTS IN WELL FORMATS AND PROPER REFERENCING.
a) What predictive model you suggest to relate risk of diabetes to the person's age, weight and the gender. Why?
Multiple regression model is the correct predictive model to predict the risk of diabetes. Here, the independent variables are age, weight and gender and the dependent variable risk of diabetes is a continuous variable and therefore, we can use multiple regression analysis to predict the risk of diabetes
b) Develop an estimated multiple regression model that relates risk of diabetes to the person's age, weight, gender and life style. Present the regression formula as a mathematical equation. Interpret the coefficients of the regression and comment on the strength of the regression.
The regression output is given below
SUMMARY OUTPUT
|
Regression Statistics
|
|
Multiple R
|
0.911
|
|
R Square
|
0.830
|
|
Adjusted R Square
|
0.783
|
|
Standard Error
|
6.188
|
|
Observations
|
24
|
ANOVA
|
df
|
SS
|
MS
|
F
|
Significance F
|
|
Regression
|
5
|
3364.69
|
672.94
|
17.58
|
0.00
|
|
Residual
|
18
|
689.14
|
38.29
|
|
|
|
Total
|
23
|
4053.83333
|
|
|
|
|
Coefficients
|
Standard Error
|
t Stat
|
P-value
|
Lower 95%
|
Upper 95%
|
|
Intercept
|
-28.19
|
10.68
|
-2.64
|
0.02
|
-50.62
|
-5.76
|
|
Small Town
|
1.20
|
3.53
|
0.34
|
0.74
|
-6.21
|
8.62
|
|
Big City
|
1.87
|
3.37
|
0.56
|
0.59
|
-5.20
|
8.94
|
|
Gender - Female
|
-4.57
|
3.32
|
-1.38
|
0.19
|
-11.55
|
2.41
|
|
Age
|
0.80
|
0.10
|
8.10
|
0.00
|
0.59
|
1.00
|
|
Weight (Kg)
|
0.37
|
0.12
|
3.06
|
0.01
|
0.12
|
0.63
|
c) What is the risk percentage of diabetes over the next 4 years for a 59-year-old man living in a small town with 72 kg weight?
The regression equation is
Risk = - 28.19 + 1.2 * Small Town + 1.87 * Big City - 4.57 * Female + 0.8 * Age + 0.37 * weight
In order to predict the risk percentage of diabetes over the next 4 years for a 59-year-old man living in a small town with 72 kg weight.
Risk = - 28.19 + 1.2 * 1 + 1.87 * 0 - 4.57 * 0 + 0.8 * 59 + 0.37 * 72 = 46.74
Therefore, the predicted risk percentage of diabetes is 46.74%
GET GUARANTEED SATISFACTION OR MONEY BACK UNDER ISYS3374 - BUSINESS ANALYTICS ASSIGNMENT HELP SERVICES OF EXPERTSMINDS.COM - ORDER TODAY NEW COPY OF THIS ASSIGNMENT!
8 - Matthew has a new job as business analyst. He plans to invest 10 percent of his annual salary after the tax into a retirement account at the end of every year for the next 30 years. Suppose that annual return is 5%, and his current salary before tax is 80k which grow 3% per year. The tax will apply as 15% on the salary up to 50k and it is 20% for the salary interval of 50k and 80k and the tax rate will be 25% for the remaining salary more than 80k (for example if his salary will be 105k, he is paying 15% tax on his first 50k and 20% in the next 30 k and 25% on his next 25k of his salary). then:
a) Create a spreadsheet which shows Matthew the balance of retirement account for various levels of annual investments and returns.
SUMMARY OUTPUT
|
Regression Statistics
|
|
Multiple R
|
0.911
|
|
R Square
|
0.830
|
|
Adjusted R Square
|
0.783
|
|
Standard Error
|
6.188
|
|
Observations
|
24
|
ANOVA
|
df
|
SS
|
MS
|
F
|
Significance F
|
|
Regression
|
5
|
3364.69
|
672.94
|
17.58
|
0.00
|
|
Residual
|
18
|
689.14
|
38.29
|
|
|
|
Total
|
23
|
4053.83333
|
|
|
|
|
Coefficients
|
Standard Error
|
t Stat
|
P-value
|
Lower 95%
|
Upper 95%
|
Lower 95.0%
|
Upper 95.0%
|
|
Intercept
|
-28.19
|
10.68
|
-2.64
|
0.02
|
-50.62
|
-5.76
|
-50.6191753
|
-5.75755864
|
|
Small Town
|
1.20
|
3.53
|
0.34
|
0.74
|
-6.21
|
8.62
|
-6.21404032
|
8.61599798
|
|
Big City
|
1.87
|
3.37
|
0.56
|
0.59
|
-5.20
|
8.94
|
-5.20410966
|
8.94299774
|
|
Gender - Female
|
-4.57
|
3.32
|
-1.38
|
0.19
|
-11.55
|
2.41
|
-11.5456618
|
2.40552778
|
|
Age
|
0.80
|
0.10
|
8.10
|
0.00
|
0.59
|
1.00
|
0.59037321
|
1.00397515
|
|
Weight (Kg)
|
0.37
|
0.12
|
3.06
|
0.01
|
0.12
|
0.63
|
0.1161364
|
0.62536827
|
b) If Matthew aims to gain $1,500,000 at the end of the 30th year, what percentage of his salary he should put in the investment annually.
The required percentage is 25%
9 - A company blends two materials: A and B to produce two types of fertilizers. Fertilizer 1 must be at least 45% of A and sells for $65 per kilo gram. Fertilizer 2 must be at least 70% of B and sells for $48 per kilogram. The price of martial A is $10 per 100 kilo grams and the price of martial B is $14 per 100 kilo grams if they purchased over 10,000 kilo gram the price will be reduced by 10%. Total budget of the company to spend on raw martial is $1600.
a) Write the linear optimization model for the company to make the best decision.
Max Z = 65 * F1 + 48 * F2
Subject to the constraints
Total Budget: 10 * F1 + 14 * F2 < = 1600
Raw material A: F1 > = 45
Raw material B: F2 > = 70
F1, F2, > = 0
b) Solve the model and present the results and interpret them.
The model is solved in excel solver and the output is given below
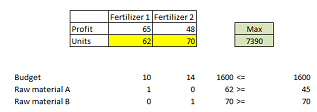
From the above solver output, we see that, on producing 62 units of Fertilizer 1 and 75 units of Fertilizer 2, the maximum profit earned is $ 7390
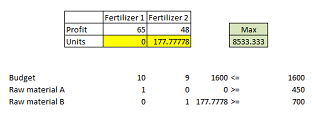
c) Rewrite the model if 10% discount only apply to the amount purchased over 10000 kilo grams (For example if the company purchases 1001 kg of A, the total price is 1000*10+1*9).
As the total budget is less, it is not possible to purchase 1000 kg of raw materials
DO WANT TO HIRE TUTOR FOR ORIGINAL ISYS3374 - BUSINESS ANALYTICS ASSIGNMENT SOLUTION? AVAIL QUALITY ISYS3374 - BUSINESS ANALYTICS ASSIGNMENT WRITING SERVICE AT BEST RATES!
Get out best RMIT University, Australia assignment help service for below mentioned courses and units, such as:
- ISYS1039 Business Analysis and Impact Management Assignment Help
- ISYS2038 Database Design and Development Assignment Help
- ISYS1168 Digital Curation Assignment Help
- ISYS2396 Enterprise Systems Assignment Help
- ISYS2421 Business Data Management and Analytics Assignment Help
- ISYS1108 Software Engineering Project Management Assignment Help
- ISYS1106 Software Engineering Project Management Assignment Help
- ISYS1117 Software Engineering Fundamentals Assignment Help
- ISYS1057 Database Concepts Assignment Help
- ISYS1084 Object Oriented Software Design Assignment Help
- ISYS1118 Software Engineering Fundamentals Assignment Help