Statistics And Research Methods, Holmes Institute, Australia
HIRE PROFESSIONAL WRITER FROM EXPERTSMINDS.COM AND GET BEST QUALITY STATISTICS AND RESEARCH METHODS ASSIGNMENT HELP AND HOMEWORK WRITING SERVICES!
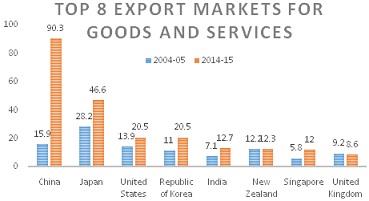
Question 1: Australian exports (goods and services) along with its top 8 export markets in 2004-05 and 2014-15. Using this data, answer the questions below.
(a) Use an appropriate graphical technique to compare the value of Australian exports (in A$ bn) in 2004-05 and 2014-15, broken down by country of export destination.
Answer:
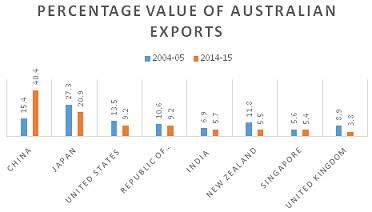
(b) Use an appropriate graphical technique to compare the percentage value of Australian exports (in %) in 2004-05 and 2014-15, broken down by country of export destination.
Answer:
(c) Comment your observations in parts (a) and (b).
Answer: In part a), the highest export of goods and service in 2014-2015 was China the least in that season was United States recorded. In 2004-05, Japan recorded the highest export and the least was Singapore.
In part b) the highest in percentage value of exportswas China with 40.4% in 2014-15. United Kingdom recorded the lowest percentage value of exports in 2014-15. Japan recorded the highest percentage value of exports in 2004-05 and the lowest was Singapore.
MOST RELIABLE AND TRUSTWORTHY STATISTICS AND RESEARCH METHODS ASSIGNMENT HELP & HOMEWORK WRITING SERVICES AT YOUR DOORSTEPS!
Question 2:
a. Construct a frequency distribution and a relative frequency distribution for the data.
b. Construct a cumulative frequency distribution and a cumulative relative frequency distribution for the data.
Answer:
|
Classes
|
frequency
|
Relative frequency
|
Cumulative frequency
|
Cumulative Relative frequency
|
|
30-40
|
2.00
|
0.05
|
2.00
|
0.05
|
|
40-50
|
4.00
|
0.10
|
6.00
|
0.15
|
|
50-60
|
8.00
|
0.20
|
14.00
|
0.35
|
|
60-70
|
11.00
|
0.28
|
25.00
|
0.63
|
|
70-80
|
8.00
|
0.20
|
33.00
|
0.83
|
|
80-90
|
5.00
|
0.13
|
38.00
|
0.95
|
|
90-100
|
2.00
|
0.05
|
40.00
|
1.00
|
| |
40.00
|
|
|
|
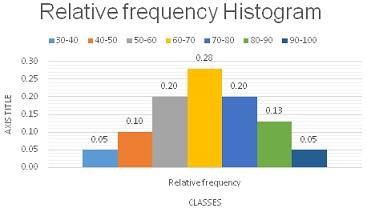
c. Plot a relative frequency histogram for the data.
Answer: Histogram
d. Construct an ogive for the data.
Answer:
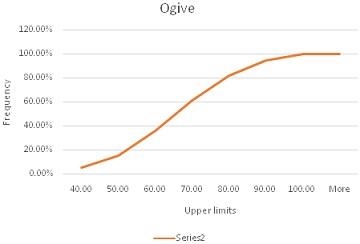
e. What proportion of the grades is less than 60?
Answer: 14/40 = 0.35
f. What proportion of the grades is more than 70?
Answer: 15/40 =0.375
GET ASSURED A++ GRADE IN EACH STATISTICS AND RESEARCH METHODS ASSIGNMENT ORDER - ORDER FOR ORIGINALLY WRITTEN SOLUTIONS!
Question 3: a. Using an appropriate graphical descriptive measure (relevant for time series data) describe the two variables.
Answer:
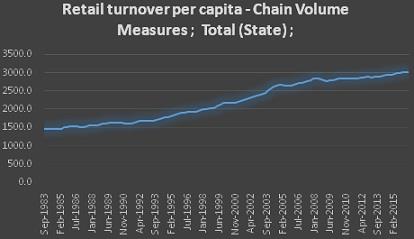
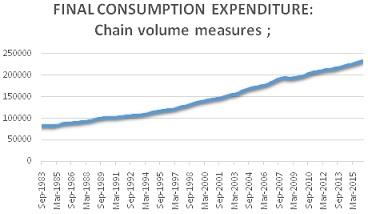
The first graph of retail turn over per capita seems to be rising from 1983-2014. The second graph of final consumption expenditure is also in an uptrend since 1983-2014.
b. Use an appropriate plot to investigate the relationship between FINAL CONSUMPTION EXPENDITURE and RETAIL TURNOVER PER CAPITA. Briefly explain the selection of each variable on the X and Y axes and why?
Answer:
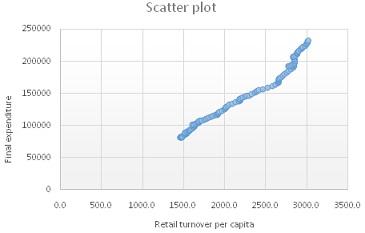
c. Prepare a numerical summary report about the data on the two variables by including the summary measures, mean, median, range, variance, standard deviation, coefficient of variation, smallest and largest values, and the three quartiles, for each variable.
Answer: x- variable is retail turnover per capita and y-axis is Final expenditure.
d. Calculate the coefficient of correlation (r) between FINAL CONSUMPTION EXPENDITURE and RETAIL TURNOVER PER CAPITA. Then, interpret it.
Answer: Descriptive Statistics Return per capita
|
Mean
|
2205.762
|
|
Median
|
2180.2
|
|
Range
|
1558.7
|
|
Variance
|
295059.6
|
|
Standard deviation
|
543.1939
|
|
Co-efficient of Variation
|
24.63
|
|
Minimum
|
1455.9
|
|
Maximum
|
3014.6
|
|
1st Quartile
|
1641.8
|
|
2nd Quartile
|
2180.2
|
|
3rd Quartile
|
2799.7
|
Descriptive Statistics Final expenditure
|
Mean
|
146019.9
|
|
Median
|
139137
|
|
Range
|
151259
|
|
Variance
|
2.200
|
|
Standard deviation
|
46904
|
|
Co-efficient of Variation
|
32.12
|
|
Minimum
|
81889
|
|
Maximum
|
233148
|
|
1st Quartile
|
103169
|
|
2nd Quartile
|
139137
|
|
3rd Quartile
|
192828
|
Coefficient of Correlation
Coefficient of correlation indicate the strength of relationship between two variables.
Correlation coeff, r: 0.9876971
P-value (two-tailed): 0.000
The coefficient of correlation is 0.988 which means that there is a strong positive correlation between Return per capita and final expenditure.
e. Estimate a simple linear regression model and present the estimated linear equation. Then, interpret the coefficient estimates of the linear model.
Answer: Regression analysis show the relationship between variables(Patten & Newhart, 2017).
Linear equation is given by Y= B0 +BX1
Regression Results:
Y= b0 + b1x:
Y Intercept, b0: -42102.53
Slope, b1: 85.28681
The linear equation is Y= -42102.53 +85.29X1
NEVER LOSE YOUR CHANCE TO EXCEL IN STATISTICS AND RESEARCH METHODS ASSIGNMENT - HIRE BEST QUALITY TUTOR FOR ASSIGNMENT HELP!
f. Determine the coefficient of determination R2 and interpret it.
Answer: The coefficient of determination R2
Coeff of Det, R^2: 0.9755456
Coefficient of Det R^2 is 0.976 meaning that 97.6% of the variation of the dependent variable (Final expenditure) can be explained by the independent variable (return in capital).
g. Test whether FINAL CONSUMPTION EXPENDITURE positively and significantly increases with RETAIL TURNOVER PER CAPITA at the 5% significance level.
Answer: The p-value 0.000< 0.05 appears to be significant.
h. What is the value of the standard error of the estimate (se). Then, comment on the fitness of the linear regression model?
Answer: Standard error is 7363.225.
The linear regression is a strong fit for the prediction.
Select our premium Holmes Institute assignment help services available for different other courses and major academic units such as -
- HI6005 - Management and Organisations in a Global Environment Assignment Help
- HI6008 - Business Research Assignment Help
- HI5002 - Finance for Business Assignment Help
- HI5003 - Economics for Business Assignment Help
- HI6006 - Competitive Strategy Assignment Help
- HI5004 - Marketing Management Assignment Help
- HI6007 - Statistics for Business Decisions Assignment Help
- HI5009 - Leading and Managing People and Relationships for Performance Assignment Help
- HI5010 - Innovation and Entrepreneurship Assignment Help
- HI6011 - Leveraging Information Technology for Business Advantage Assignment Help