WORK TOGETHER WITH EXPERTSMIND'S TUTOR TO ACHIEVE SUCCESS IN REGRESSION ANALYSIS AND INFERENCE ASSIGNMENT!
Task A: Downloading the data
Download the data for S&P 500 index, Boeing Stock Price, General Dynamics Corp. Stock Price, and US TN (10 Year)
Calculations
|
rt_S&P
|
rt_Boeng
|
rt_GD
|
S&P (x-xb)
|
Boeng(x-xb)
|
GD(x-xb)
|
|
|
0.00
|
0.00
|
0.00
|
-0.06
|
-1.02
|
-1.11
|
|
|
0.08
|
1.36
|
1.31
|
0.02
|
0.34
|
0.20
|
|
|
0.07
|
1.26
|
1.38
|
0.01
|
0.24
|
0.27
|
|
|
0.07
|
1.29
|
1.36
|
0.01
|
0.27
|
0.25
|
|
|
0.08
|
1.36
|
1.35
|
0.02
|
0.34
|
0.24
|
|
|
0.08
|
1.43
|
1.48
|
0.02
|
0.41
|
0.37
|
|
|
0.08
|
1.51
|
1.57
|
0.02
|
0.49
|
0.46
|
|
|
0.09
|
1.67
|
1.77
|
0.03
|
0.65
|
0.66
|
|
|
0.08
|
1.53
|
1.57
|
0.02
|
0.51
|
0.46
|
|
|
0.08
|
1.47
|
1.53
|
0.02
|
0.45
|
0.42
|
|
|
0.08
|
1.37
|
1.52
|
0.02
|
0.35
|
0.41
|
|
|
0.08
|
1.36
|
1.46
|
0.02
|
0.34
|
0.35
|
|
|
0.07
|
1.34
|
1.37
|
0.01
|
0.32
|
0.26
|
|
|
0.07
|
1.35
|
1.37
|
0.01
|
0.33
|
0.26
|
|
|
0.07
|
1.31
|
1.49
|
0.01
|
0.29
|
0.38
|
|
|
0.08
|
1.45
|
1.57
|
0.02
|
0.43
|
0.46
|
|
|
0.07
|
1.36
|
1.53
|
0.01
|
0.34
|
0.42
|
|
|
0.07
|
1.36
|
1.59
|
0.01
|
0.34
|
0.48
|
|
|
0.07
|
1.41
|
1.54
|
0.01
|
0.39
|
0.43
|
|
|
0.07
|
1.45
|
1.52
|
0.01
|
0.43
|
0.41
|
|
|
0.07
|
1.43
|
1.48
|
0.01
|
0.41
|
0.37
|
|
|
0.07
|
1.36
|
1.52
|
0.01
|
0.34
|
0.41
|
|
|
0.07
|
1.34
|
1.45
|
0.01
|
0.32
|
0.34
|
|
|
0.07
|
1.36
|
1.52
|
0.01
|
0.34
|
0.41
|
|
|
0.07
|
1.31
|
1.48
|
0.01
|
0.29
|
0.37
|
|
|
0.06
|
1.17
|
1.43
|
0.00
|
0.15
|
0.32
|
|
|
0.06
|
1.10
|
1.36
|
0.00
|
0.08
|
0.25
|
|
|
0.06
|
1.02
|
1.31
|
0.00
|
0.00
|
0.20
|
|
|
0.06
|
0.98
|
1.28
|
0.00
|
-0.04
|
0.17
|
|
|
0.06
|
0.96
|
1.18
|
0.00
|
-0.06
|
0.07
|
|
|
0.06
|
0.97
|
1.21
|
0.00
|
-0.05
|
0.10
|
|
|
0.06
|
0.85
|
1.15
|
0.00
|
-0.17
|
0.04
|
|
|
0.06
|
0.77
|
1.16
|
0.00
|
-0.25
|
0.05
|
|
|
0.06
|
0.75
|
1.10
|
0.00
|
-0.27
|
-0.01
|
|
|
0.05
|
0.74
|
1.05
|
-0.01
|
-0.28
|
-0.06
|
|
|
0.06
|
0.80
|
0.99
|
0.00
|
-0.22
|
-0.12
|
|
|
0.05
|
0.78
|
0.92
|
-0.01
|
-0.24
|
-0.19
|
|
|
0.05
|
0.80
|
0.92
|
-0.01
|
-0.22
|
-0.19
|
|
|
0.05
|
0.78
|
0.92
|
-0.01
|
-0.24
|
-0.19
|
|
|
0.05
|
0.74
|
0.85
|
-0.01
|
-0.28
|
-0.26
|
|
|
0.05
|
0.79
|
0.86
|
-0.01
|
-0.23
|
-0.25
|
|
|
0.05
|
0.83
|
0.86
|
-0.01
|
-0.19
|
-0.25
|
|
|
0.05
|
0.79
|
0.81
|
-0.01
|
-0.23
|
-0.30
|
|
|
0.05
|
0.79
|
0.79
|
-0.01
|
-0.23
|
-0.32
|
|
|
0.05
|
0.80
|
0.72
|
-0.01
|
-0.22
|
-0.39
|
|
|
0.05
|
0.75
|
0.69
|
-0.01
|
-0.27
|
-0.42
|
|
|
0.05
|
0.77
|
0.73
|
-0.01
|
-0.25
|
-0.38
|
|
|
0.05
|
0.69
|
0.75
|
-0.01
|
-0.33
|
-0.36
|
|
|
0.05
|
0.67
|
0.72
|
-0.01
|
-0.35
|
-0.39
|
|
|
0.05
|
0.67
|
0.74
|
-0.01
|
-0.35
|
-0.37
|
|
|
0.05
|
0.70
|
0.73
|
-0.01
|
-0.32
|
-0.38
|
|
|
0.05
|
0.71
|
0.72
|
-0.01
|
-0.31
|
-0.39
|
|
|
0.05
|
0.72
|
0.71
|
-0.01
|
-0.30
|
-0.40
|
|
|
0.05
|
0.70
|
0.67
|
-0.01
|
-0.32
|
-0.44
|
|
|
0.05
|
0.77
|
0.69
|
-0.01
|
-0.25
|
-0.42
|
|
|
0.05
|
0.77
|
0.73
|
-0.01
|
-0.25
|
-0.38
|
|
|
0.05
|
0.68
|
0.68
|
-0.01
|
-0.34
|
-0.43
|
|
|
0.05
|
0.69
|
0.69
|
-0.01
|
-0.33
|
-0.42
|
|
|
0.05
|
0.69
|
0.73
|
-0.01
|
-0.33
|
-0.38
|
|
|
0.05
|
0.84
|
0.75
|
-0.01
|
-0.18
|
-0.36
|
|
|
0.05
|
0.85
|
0.74
|
-0.01
|
-0.17
|
-0.37
|
|
|
0.05
|
0.79
|
0.76
|
-0.01
|
-0.23
|
-0.35
|
|
|
0.06
|
1.02
|
1.11
|
0.02
|
-0.16
|
0.02
|
Sum
|
|
0.01
|
0.31
|
0.34
|
|
|
|
|
|
62
|
62
|
62
|
JB test
|
|
|
|
|
|
|
K3
|
183.43933
|
-0.08719
|
0.007307
|
|
|
|
|
K4
|
15724.1905
|
-3.28337
|
-2.97871
|
|
|
|
JB
|
n[(K3)^2/6 + (k4)^2/24]
|
639077317
|
27.92822
|
22.9217
|
|
|
|
|
K3^2
|
33649.9879
|
0.007602
|
5.34E-05
|
|
|
|
|
K3^2/6
|
5608.33131
|
0.001267
|
8.9E-06
|
|
|
|
|
K4^2
|
247250168
|
10.78051
|
8.872705
|
|
|
|
|
K4^2/24
|
10302090.3
|
0.449188
|
0.369696
|
|
|
|
|
K3^2/6 + K4^2/24
|
10307698.7
|
0.450455
|
0.369705
|
|
|
|
JB
|
n[(K3)^2/6 + (k4)^2/24]
|
639077317
|
27.92822
|
22.9217
|
|
|
JB Test calculation
|
|
n[(K3)^2/6 + (k4)^2/24]
|
6.39E+08
|
|
33649.99
|
|
K3^2/6
|
5608.331
|
|
K4^2
|
2.47E+08
|
|
K4^2/24
|
10302090
|
|
10307699
|
|
6.39E+08
|
|
Null Hypothesis H0: The mean stock returns of GD is not equal to 2.8 percent
|
|
Alternate Hypothesis H1: The mean return of GD stock is equal to 2.8%
|
|
One-Sample Statistics
|
|
N
|
Mean
|
Std. Deviation
|
Std. Error Mean
|
|
rt_GD
|
62
|
1.1102
|
.37165
|
.04720
|
One-Sample Test
|
|
Test Value = 2.8
|
|
|
t
|
Df
|
Sig. (2-tailed)
|
Mean Difference
|
95% Confidence Interval of the Difference
|
|
|
Lower
|
Upper
|
|
rt_GD
|
-35.802
|
61
|
.000
|
-1.68984
|
-1.7842
|
-1.5955
|
|
|
|
|
|
|
|
There exists mean difference of -1.68 for GD stock returns from t test statistics, t (61) = -35.8, 0.00<0.005 at 95% C.I. Hence, null hypothesis stating mean stock returns of GD is not equal to 0 is accepted
|
rt_Boeng
|
rt_GD
|
|
0
|
0
|
|
1.361862
|
1.31477
|
|
1.261369
|
1.382765
|
|
1.289841
|
1.356505
|
|
1.361862
|
1.351007
|
|
1.429208
|
1.478442
|
|
1.50696
|
1.572854
|
|
1.666428
|
1.773411
|
|
1.531658
|
1.570137
|
|
1.466517
|
1.52535
|
|
1.372705
|
1.517249
|
|
1.357241
|
1.456478
|
|
1.343204
|
1.37497
|
|
1.35375
|
1.37214
|
|
1.310635
|
1.492565
|
|
1.446994
|
1.574588
|
|
1.355034
|
1.52768
|
|
1.362233
|
1.588848
|
|
1.410461
|
1.538255
|
|
1.447203
|
1.523955
|
|
1.429821
|
1.479755
|
|
1.355402
|
1.515181
|
|
1.335847
|
1.454148
|
|
1.362976
|
1.519786
|
|
1.308919
|
1.482167
|
|
1.17166
|
1.428392
|
|
1.1
|
1.361306
|
|
1.015031
|
1.305502
|
|
0.980977
|
1.284869
|
|
0.95603
|
1.178703
|
|
0.966939
|
1.208474
|
|
0.854706
|
1.149174
|
|
0.769235
|
1.161049
|
|
0.747667
|
1.096983
|
|
0.735351
|
1.052088
|
|
0.801543
|
0.991973
|
|
0.778699
|
0.917101
|
|
0.800068
|
0.922346
|
|
0.778093
|
0.917859
|
|
0.742118
|
0.850201
|
|
0.789083
|
0.861703
|
|
0.833477
|
0.860072
|
|
0.79177
|
0.814668
|
|
0.78815
|
0.789956
|
|
0.803798
|
0.718084
|
|
0.747053
|
0.690324
|
|
0.772324
|
0.729291
|
|
0.690277
|
0.753526
|
|
0.665117
|
0.723174
|
|
0.668541
|
0.739484
|
|
0.700087
|
0.730891
|
|
0.714187
|
0.716028
|
|
0.723487
|
0.708268
|
|
0.696042
|
0.672905
|
|
0.768171
|
0.691231
|
|
0.766581
|
0.727541
|
|
0.677647
|
0.675313
|
|
0.689896
|
0.685122
|
|
0.694013
|
0.730677
|
|
0.835916
|
0.75036
|
Risk returns of Boeng and GD are computed and depicted in above table. F statistical testing was performed to observe differences
F-Test Two-Sample for Variances
|
F-Test Two-Sample for Variances
|
|
|
|
|
|
rt_Boeng
|
rt_GD
|
|
Mean
|
1.01746
|
1.110295
|
|
Variance
|
0.111919
|
0.138301
|
|
Observations
|
62
|
62
|
|
Df
|
61
|
61
|
|
F
|
0.809245
|
|
|
P(F<=f) one-tail
|
0.205428
|
|
|
F Critical one-tail
|
0.654094
|
|
F (61) = 0.80, F critical is greater than F statistics suggesting a slight mean variation between risk returns of the Boeng and GD stocks.
|
Correlation
|
|
|
|
rt_Boeng
|
rt_GD
|
|
rt_Boeng
|
1
|
|
|
rt_GD
|
0.952110318
|
1
|
So, we get r=0.95 which is based upon the correlation statistical testing which is just performed, since r value is positive and close to 1, it can be inferred that the risks associated with the Boeng and GD company stocks are same.
Regression Model
CAPM
|
SUMMARY OUTPUT
|
|
|
|
|
|
|
|
|
|
|
|
|
|
|
|
|
|
|
|
Regression Statistics
|
|
|
|
|
|
|
|
|
|
Multiple R
|
0.602263437
|
|
|
|
|
|
|
|
|
R Square
|
0.362721247
|
|
|
|
|
|
|
|
|
Adjusted R Square
|
0.352099934
|
|
|
|
|
|
|
|
|
Standard Error
|
0.507227183
|
|
|
|
|
|
|
|
|
Observations
|
62
|
|
|
|
|
|
|
|
|
|
|
|
|
|
|
|
|
|
|
ANOVA
|
|
|
|
|
|
|
|
|
|
|
df
|
SS
|
MS
|
F
|
Significance F
|
|
|
|
|
Regression
|
1
|
8.786175
|
8.786175
|
34.15032
|
2.24E-07
|
|
|
|
|
Residual
|
60
|
15.43676
|
0.257279
|
|
|
|
|
|
|
Total
|
61
|
24.22294
|
|
|
|
|
|
|
|
|
|
|
|
|
|
|
|
|
|
|
Coefficients
|
Standard Error
|
t Stat
|
P-value
|
Lower 95%
|
Upper 95%
|
Lower 95.0%
|
Upper 95.0%
|
|
Intercept
|
0.604712092
|
0.294961
|
2.05014
|
0.044728
|
0.014702
|
1.194723
|
0.014702
|
1.194723
|
|
xt_GD
|
-0.001012065
|
0.000173
|
-5.84383
|
2.24E-07
|
-0.00136
|
-0.00067
|
-0.00136
|
-0.00067
|
|
|
|
|
|
|
|
|
|
|
|
|
|
|
|
|
|
|
|
|
|
|
|
|
|
|
|
|
|
|
|
RESIDUAL OUTPUT
|
|
|
|
|
PROBABILITY OUTPUT
|
|
|
|
|
|
|
|
|
|
|
|
|
|
|
Observation
|
Predicted Yt_GD
|
Residuals
|
Standard Residuals
|
|
Percentile
|
Yt_GD
|
|
|
|
1
|
0.604712092
|
-0.60471
|
-1.20209
|
|
0.806452
|
-2.13923
|
|
|
|
2
|
-0.735735938
|
-1.40349
|
-2.78996
|
|
2.419355
|
-1.97391
|
|
|
|
3
|
-0.774073496
|
-1.13916
|
-2.2645
|
|
4.032258
|
-1.91323
|
|
|
|
4
|
-0.755412526
|
-0.93808
|
-1.86478
|
|
5.645161
|
-1.80699
|
|
|
|
5
|
-0.73048338
|
-1.07651
|
-2.13996
|
|
7.258065
|
-1.80065
|
|
|
|
6
|
-0.701713067
|
-0.62484
|
-1.24211
|
|
8.870968
|
-1.7409
|
|
|
|
7
|
-0.6273589
|
-0.01779
|
-0.03536
|
|
10.48387
|
-1.73014
|
|
|
|
8
|
-0.538672197
|
0.388083
|
0.771456
|
|
12.09677
|
-1.71804
|
|
|
|
9
|
-0.662159101
|
0.057297
|
0.113898
|
|
13.70968
|
-1.69593
|
|
|
|
10
|
-0.655808446
|
0.113158
|
0.224944
|
|
15.32258
|
-1.6935
|
|
|
|
11
|
-0.666671778
|
0.312921
|
0.622045
|
|
16.93548
|
-1.67603
|
|
|
|
12
|
-0.722158779
|
0.379637
|
0.754666
|
|
18.54839
|
-1.6543
|
|
|
|
13
|
-0.776085718
|
0.174056
|
0.345999
|
|
20.16129
|
-1.64402
|
|
|
|
14
|
-0.819381229
|
-0.02448
|
-0.04866
|
|
21.77419
|
-1.62673
|
|
|
|
15
|
-0.80873752
|
0.386303
|
0.767917
|
|
23.3871
|
-1.61692
|
|
|
|
16
|
-0.719962769
|
0.71355
|
1.418442
|
|
25
|
-1.6068
|
|
|
|
17
|
-0.772511255
|
0.641191
|
1.274602
|
|
26.6129
|
-1.54053
|
|
|
|
18
|
-0.789870919
|
0.886719
|
1.762677
|
|
28.22581
|
-1.53832
|
|
|
|
19
|
-0.817411016
|
0.793666
|
1.577701
|
|
29.83871
|
-1.53288
|
|
|
|
20
|
-0.851875221
|
0.73883
|
1.468694
|
|
31.45161
|
-1.5321
|
|
|
|
21
|
-0.823038825
|
0.616794
|
1.226102
|
|
33.06452
|
-1.52833
|
|
|
|
22
|
-0.827182664
|
0.736363
|
1.46379
|
|
34.67742
|
-1.50877
|
|
|
|
23
|
-0.837333113
|
0.535481
|
1.064464
|
|
36.29032
|
-1.50368
|
|
|
|
24
|
-0.910093428
|
0.444879
|
0.88436
|
|
37.90323
|
-1.47569
|
|
|
|
25
|
-0.926918127
|
0.521085
|
1.035847
|
|
39.51613
|
-1.46583
|
|
|
|
26
|
-0.982224601
|
0.558616
|
1.110453
|
|
41.12903
|
-1.44071
|
|
|
|
27
|
-1.01101954
|
0.697326
|
1.386189
|
|
42.74194
|
-1.4143
|
|
|
|
28
|
-1.04467578
|
0.186177
|
0.370095
|
|
44.35484
|
-1.38095
|
|
|
|
29
|
-1.019955171
|
-0.17318
|
-0.34425
|
|
45.96774
|
-1.37897
|
|
|
|
30
|
-1.100388947
|
-0.31391
|
-0.62401
|
|
47.58065
|
-1.33246
|
|
|
|
31
|
-1.046981339
|
-0.49354
|
-0.9811
|
|
49.19355
|
-1.32656
|
|
|
|
32
|
-1.096261131
|
-0.36957
|
-0.73465
|
|
50.80645
|
-1.31511
|
|
|
|
33
|
-1.172242391
|
-0.20871
|
-0.41488
|
|
52.41935
|
-1.27883
|
|
|
|
34
|
-1.22212869
|
-0.42189
|
-0.83866
|
|
54.03226
|
-1.19452
|
|
|
|
35
|
-1.265204452
|
-0.70871
|
-1.40882
|
|
55.64516
|
-1.19313
|
|
|
|
36
|
-1.198573916
|
-0.47745
|
-0.94911
|
|
57.25806
|
-1.18064
|
|
|
|
37
|
-1.27638435
|
-0.46451
|
-0.92339
|
|
58.87097
|
-1.02188
|
|
|
|
38
|
-1.289408258
|
-0.51125
|
-1.01629
|
|
60.48387
|
-1.00346
|
|
|
|
39
|
-1.30118056
|
-0.42896
|
-0.85272
|
|
62.09677
|
-0.92147
|
|
|
|
40
|
-1.341314986
|
-0.26548
|
-0.52775
|
|
63.70968
|
-0.8585
|
|
|
|
41
|
-1.378369798
|
-0.27593
|
-0.54851
|
|
65.32258
|
-0.84386
|
|
|
|
42
|
-1.348408287
|
-0.34752
|
-0.69082
|
|
66.93548
|
-0.64515
|
|
|
|
43
|
-1.422027586
|
-0.1063
|
-0.21132
|
|
68.54839
|
-0.60486
|
|
|
|
44
|
-1.390576308
|
-0.32747
|
-0.65096
|
|
70.16129
|
-0.60203
|
|
|
|
45
|
-1.436872584
|
-0.18004
|
-0.3579
|
|
71.77419
|
-0.54265
|
|
|
|
46
|
-1.487037371
|
-0.01664
|
-0.03307
|
|
73.3871
|
-0.46521
|
|
|
|
47
|
-1.478247151
|
0.037539
|
0.074622
|
|
75
|
-0.42361
|
|
|
|
48
|
-1.413649192
|
0.492175
|
0.978378
|
|
76.6129
|
-0.42243
|
|
|
|
49
|
-1.524505922
|
0.245679
|
0.488377
|
|
78.22581
|
-0.40583
|
|
|
|
50
|
-1.487450643
|
0.292935
|
0.582315
|
|
79.83871
|
-0.35375
|
|
|
|
51
|
-1.505251423
|
0.190142
|
0.377976
|
|
81.45161
|
-0.34252
|
|
|
|
52
|
-1.527381021
|
0.148409
|
0.295016
|
|
83.06452
|
-0.31369
|
|
|
|
53
|
-1.482557579
|
-0.14417
|
-0.2866
|
|
84.67742
|
-0.30185
|
|
|
|
54
|
-1.52380675
|
-0.00829
|
-0.01648
|
|
86.29032
|
-0.20625
|
|
|
|
55
|
-1.390485216
|
-0.11828
|
-0.23513
|
|
87.90323
|
-0.15059
|
|
|
|
56
|
-1.337707601
|
0.005248
|
0.010433
|
|
89.51613
|
-0.13132
|
|
|
|
57
|
-1.499050031
|
0.023363
|
0.046443
|
|
91.12903
|
-0.11304
|
|
|
|
58
|
-1.500100106
|
-0.03278
|
-0.06516
|
|
92.74194
|
-0.09082
|
|
|
|
59
|
-1.463185951
|
-0.07514
|
-0.14936
|
|
94.35484
|
-0.02374
|
|
|
|
60
|
-1.358091228
|
0.177451
|
0.352749
|
|
95.96774
|
-0.00641
|
|
|
|
61
|
-1.349970557
|
0.346514
|
0.688822
|
|
97.58065
|
0
|
|
|
|
62
|
-1.479078582
|
0.457199
|
0.90885
|
|
99.19355
|
0.096848
|
|
|
The CAPM for regression model infers that Boeng = 0.001GD + 0.60
This infers that there is no difference in CAMP of both stocks are fair value and no variation in their risk level
GETTING STUCK WITH SIMILAR REGRESSION ANALYSIS AND INFERENCE ASSIGNMENT? ENROL WITH EXPERTSMINDS'S REGRESSION ANALYSIS AND INFERENCE ASSIGNMENT HELP SERVICES AND GET DISTRESSED WITH YOUR ASSIGNMENT WORRIES!
Task B: Hypothesis Testing of Means and Variances Equality
Question 1: Calculate returns for these three series in Excel or any software of your choice using the transformation: rt = 100*ln(Pt / Pt-1) and perform the Jarque-Berra test of normally distributed returns for each of Boeing and GD. What do you infer about the distribution of the two stock returns series? Describe also the risk and average return relationship in each of the two stocks.
Answer:
|
JB_Boeng
|
JB_GD
|
|
|
|
|
|
|
|
27.9282161
|
22.9217
|
|
|
|
|
|
|
|
|
|
|
|
JB Test calculation
|
|
|
|
|
|
|
n[(K3)^2/6 + (k4)^2/24]
|
6.39E+08
|
|
|
The chi square critical value
|
|
|
|
33649.99
|
|
|
|
|
|
|
K3^2/6
|
5608.331
|
|
|
H0: Normal distribution of data
|
|
|
K4^2
|
2.47E+08
|
|
|
H1: Means there is no normal distribution of data
|
|
K4^2/24
|
10302090
|
|
|
|
|
|
|
|
10307699
|
|
|
|
|
|
|
|
6.39E+08
|
|
|
|
|
|
|
|
|
|
|
JB
|
Boeng
|
27.92
|
p<0.05> 0.01
|
|
|
|
|
JB
|
GD
|
22.92
|
p<0.05> 0.01
|
|
|
|
|
|
|
|
|
|
|
|
|
We usually do not take Null theory into account when the significance level is 5%
|
Question 2:
Test a hypothesis that the average return on GD stock is different from 2.8%. Which test statistic would you choose to perform this hypothesis test and why? Also, specify the distribution of the test statistic under the null hypothesis.
Answer:
|
One-Sample Statistics
|
|
|
N
|
Mean
|
Std. Deviation
|
Std. Error Mean
|
|
rt_GD
|
62
|
1.1102
|
.37165
|
.04720
|
The mean GD stock rate is 1.11% with deviation of 0.37
|
One-Sample Test
|
|
|
Test Value = 2.8
|
|
|
t
|
df
|
Sig. (2-tailed)
|
Mean Difference
|
95% Confidence Interval of the Difference
|
|
|
Lower
|
Upper
|
|
rt_GD
|
-35.802
|
61
|
.000
|
-1.68984
|
-1.7842
|
-1.5955
|
In regards to a Student T-test was led to assess the accompanying expressed theory
M1 = 28% normal returns of GD stocks are 2.8%.
H0: The mean returns of GD isn't approach to 2.8 percent
H1: The mean GD stock return is 2.8%
The outcomes propose that t(61) = 35.80, alpha = 0.000< 0.005 has a measurable noteworthy mean distinction 1.68. The mean supply of GD esteem is observed to be 1.11 which isn't rise to conjectured mean stock esteem 2.8% in this test. It is henceforth deduced that invalid speculation expressing that the normal return isn't rise to 2.8 percent for GD Stock is acknowledged
Question 3: Before investing in one of the two stocks, you first want to compare risk associated with each of the two stocks. Perform an appropriate hypothesis test using 5% significance level and interpret your results.
Answer:
|
F-Test Two-Sample for Variances
|
|
|
|
|
|
rt_Boeng
|
rt_GD
|
|
Mean
|
1.01746
|
1.110295
|
|
Variance
|
0.111919
|
0.138301
|
|
Observations
|
62
|
62
|
|
Df
|
61
|
61
|
|
F
|
0.809245
|
|
|
P(F<=f) one-tail
|
0.205428
|
|
|
F Critical one-tail
|
0.654094
|
|
Invalid theory H0: There is no mean distinction between hazard returns of Boeng and GD.
Interchange theory H1: The danger of putting resources into GD stocks is higher than Boeng stocks. A F test is led to assess the distinctions in mean hazard free return rates. The F(61) = 0.80, p<0.25 is lesser than F basic esteem (0.65). This construes recommending that there is a noteworthy variety in hazard related with GD and Boeng stocks. Henceforth, invalid theory is rejected. The hazard related with GD is higher than Boeng since mean returns of GD is higher than Boeng stocks.
Question 4: Besides, you want to determine whether both stocks have same population average return. Perform an appropriate hypothesis test using information in your sample of 60 observations on returns. Report your findings and also mention which stock will you prefer and why?
Answer:
H0: There is no mean varieties in normal returns of GD and Beong stocks
H1: There is a measurable critical mean contrast in populace normal returns of GD and Boeng stocks
Connection investigation was performed to evaluate whether there is any connection between populace normal returns of GD and Boeng stocks. The r esteem near 1 to - 1 demonstrates the positive to negative relationship held between factors
|
|
rt_Boeng
|
rt_GD
|
|
rt_Boeng
|
1
|
1
|
|
rt_GD
|
0.95216012
|
1
|
As per the mentioned connection grid detailed that the loads of GD and Boeng have comparative populace mean returns, since, Pearson's r esteem is 0.95 at 95% C.I. This deduces recommending that populace normal of GD and Boeng stock returns have solid positive connection between them. Thus, invalid speculation is acknowledged.
GET READYMADE REGRESSION ANALYSIS AND INFERENCE ASSIGNMENT SOLUTIONS - 100% PLAGIARISM FREE WORK DOCUMENT AT NOMINAL CHARGES!
Task C: Regression Analysis and Inference
Question 5: Compute excess return on your preferred stock as yt = rt - rf,t and excess market return as xt = rM,t - rf,t and perform the following tasks.
Answer:
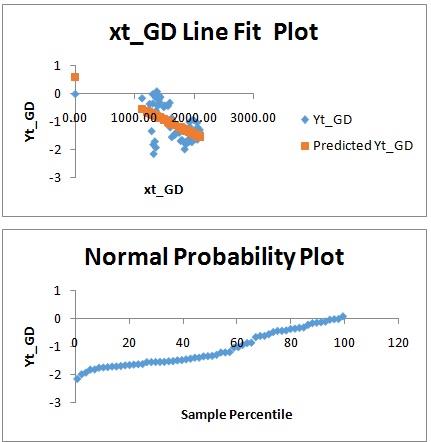
a. Estimate the CAPM using linear regression by regressing the excess return on your preferred stock (yt) on excess market return (xt) and properly report your regression results.
Relapse investigation is led to evaluate the peril of putting resources into GD stocks. The overabundance returns and market returns of GD stock were determined by subtracting the SP 500 returns and CBOE US treasury premium returns. CAMP Beta coefficient esteem is assessed utilizing relapse.
b. Interpret the estimated CAPM beta-coefficient in terms of the stock's riskiness in comparison with the market.
|
|
Coefficients
|
Standard Error
|
t Stat
|
P-value
|
Lower 95%
|
Upper 95%
|
Lower 95.0%
|
Upper 95.0%
|
|
Intercept
|
0.604712
|
0.294961
|
2.05014
|
0.044728
|
0.014702
|
1.194723
|
0.014702
|
1.194723
|
|
xt_GD
|
-0.00101
|
0.000173
|
-5.84383
|
2.24E-07
|
-0.00136
|
-0.00067
|
-0.00136
|
-0.00067
|
The Beta coefficient of CAMP GD stock is - 0.00101 is seen from the above determined Regression results.
c. Interpret the value of R2.
|
Regression Statistics
|
|
Multiple R
|
0.602263
|
|
R Square
|
0.362721
|
|
Adjusted R Square
|
0.3521
|
|
Standard Error
|
0.507227
|
|
Observations
|
62
|
The R squared estimation of the assessed CAPM model for GD stock is 0.36. This gathers this model gauges the danger of contributing GD stocks 36% correctly. Expanded dimension of standard blunder rate is the purpose behind less R squared esteem.
d. Interpret 95% confidence interval for the slope coefficient.
Question 6: Using the confidence interval approach to hypothesis testing, perform the hypothesis test to determine whether your preferred stock is a neutral stock.
Answer:
H0: The abundance market returns of GD stock is seen to impartial
H1: The abundance market returns of GD stock is certainly not an unbiased stock
The t(- 5.85) has p esteem = 2.24 more noteworthy than p<0.005 at 95% C.I. Henceforth, it is obvious that invalid speculation is rejected. This gathers overabundance market returns of GD stock is certainly not an impartial stock and it is less hazardous in nature.
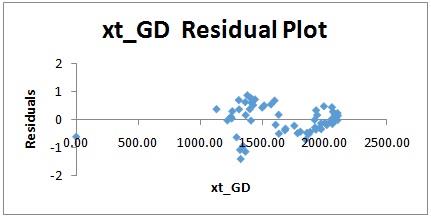
Question 7: One of the assumptions of ordinary least squares (OLS) method is; normally distributed error term in the model. Perform an appropriate hypothesis test to determine whether it is plausible to assume normally distributed errors.
Answer:
The blunder term in relapse model as a rule gauges the likelihood of expectation of relapse model. The evaluated standard blunder is 0.50.
Invalid Hypothesis H0: The mistake term isn't regularly disseminated
Substitute Hypothesis H1: The blunder term is dispersed ordinarily
The standard blunder of beta coefficient esteem is observed to be 0.00 at 5% hugeness dimension in the relapse table. This construes, invalid speculation expressing that blunder term isn't circulated regularly is acknowledged.
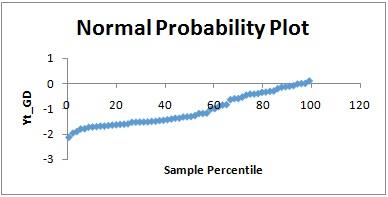
Moreover, the likelihood plot likewise displays the negative straight pattern suggesting that blunder term isn't regularly appropriated
Proposal
The mean stock returns of GD and Boeng were thought about by figuring the normal hazard free returns, abundance returns and market returns. The normal stock returns of GD are nearly higher than Boeng. Likewise, the hazard free return for GD stock is seen to be bigger than Boeng's without hazard return rate. Factual test were performed to looking at the populace mean of normal return and a positive solid connection was seen among GD and Boeng. Notwithstanding, results acquired from relapse testing has registered estimation of CAPM Beta Coefficient of GD stocks. This uncovered CAPM of GD stocks is exceedingly less secure at 5% Significance dimension. The overabundance returns of stock additionally delineate the solid negative association with the abundance market returns. Henceforth, it is more dangerous to put resources into GD stocks.
SAVE YOUR HIGHER GRADE WITH ACQUIRING REGRESSION ANALYSIS AND INFERENCE ASSIGNMENT HELP & QUALITY HOMEWORK WRITING SERVICES OF EXPERTSMINDS.COM