MGMT 650 Statistics for Managerial Decision Making Assignment - University of Maryland Global Campus, USA
GET ASSURED A++ GRADE IN EACH MGMT 650 STATISTICS FOR MANAGERIAL DECISION MAKING ASSIGNMENT ORDER - ORDER FOR ORIGINALLY WRITTEN SOLUTIONS!
Question 1 - Create a spreadsheet that automatically calculates your grade in this class as you enter the grades that you receive. It should include: 1) the weights of each graded assignment, 2) your grade in each assignment, and 3) your final grade.
|
Assignment
|
Mark
|
Weight of Grade
|
My Grade
|
Final Grade
|
|
Assignment 1
|
82
|
3.28
|
0.328
|
B
|
|
Assignment 2
|
92
|
3.68
|
0.368
|
B
|
|
Assignment 3
|
62
|
2.48
|
0.248
|
C
|
|
Assignment 4
|
78
|
3.12
|
0.312
|
B
|
|
Assignment 5
|
52
|
2.08
|
0.208
|
C
|
|
Assignment 6
|
42
|
1.68
|
0.168
|
D
|
Question 2 - Here is sample data showing the length of nails in boxes labled 1 1/4 inch. The data is in inches.
|
1.26
|
1.22
|
1.27
|
1.21
|
1.22
|
1.25
|
1.22
|
1.25
|
1.25
|
1.23
|
|
1.24
|
1.24
|
1.29
|
1.24
|
1.27
|
1.29
|
1.23
|
1.22
|
1.23
|
1.26
|
|
1.28
|
1.25
|
1.25
|
1.23
|
1.26
|
1.23
|
1.26
|
1.29
|
1.26
|
1.26
|
|
1.23
|
1.21
|
1.23
|
1.21
|
1.22
|
1.22
|
1.24
|
1.21
|
1.23
|
1.25
|
|
1.21
|
1.28
|
1.26
|
1.25
|
1.22
|
1.29
|
1.22
|
1.22
|
1.29
|
1.24
|
|
1.21
|
1.22
|
1.23
|
1.26
|
1.28
|
1.26
|
1.28
|
1.21
|
1.21
|
1.21
|
|
1.29
|
1.26
|
1.26
|
1.28
|
1.25
|
1.24
|
1.24
|
1.27
|
1.28
|
1.24
|
|
1.21
|
1.25
|
1.23
|
1.25
|
1.29
|
1.29
|
1.22
|
1.21
|
1.28
|
1.27
|
For the following questions, you must use Excel formulas in the cells so that Excel calculates the answers for you.
1) Compute the mean
1.25
Compute the median
1.25
Find the mode
1.26
NO PLAGIARISM POLICY - ORDER NEW MGMT 650 STATISTICS FOR MANAGERIAL DECISION MAKING ASSIGNMENT & GET WELL WRITTEN SOLUTIONS DOCUMENTS WITH FREE TURNTIN REPORT!
2) Compute the first quartile; use = QUARTILE.EXC()
1.22 First Quartile
Compute the third quartile; use =QUARTILE.EXC()
1.26 Third Quartile
3) Compute the interquartile range
0.04
4) Find the largest number
1.29
Find the smallest number
1.21
What is the range?
0.08
5) What is the Variance? Use =VAR.S()
0.00
What is the standard deviation? Use =STDEV.S()
0.03
6) What is the Coefficient of Variation, or the CV?
2.07
7) When is the Coefficient of Variation especially useful?
Coefficient of variation(CV) is the ratio of standard deviation and mean. CV is use to compare the two data set. Its unit free measurement. Its useful when we measure the variability of two data set.
Copy all of the data into a column, use Column M and go from cell M1:M80
ENDLESS SUPPORT IN MGMT 650 STATISTICS FOR MANAGERIAL DECISION MAKING ASSIGNMENTS WRITING SERVICES - YOU GET REVISED OR MODIFIED WORK TILL YOU ARE SATISFIED WITH OUR MGMT 650 STATISTICS FOR MANAGERIAL DECISION MAKING ASSIGNMENT HELP SERVICES!
8) Use the Data Analysis tool on the numbers just copied to find the Descriptive Statistics:
Click on Data Analysis and Choose Descriptive Statistics
Click on the Summary Statistics box.
Highlight the mean, median, mode, Standard deviation, Range, Minimum, and Maximum
Notice that the Data Analysis tool gives you all of the info needed for this problem except for the quartiles, variance, and CV length of nails
|
length of nails
|
|
1.26
|
|
1.24
|
|
1.28
|
|
1.23
|
|
1.21
|
|
1.21
|
|
1.29
|
|
1.21
|
|
1.22
|
|
1.24
|
|
1.25
|
|
1.21
|
|
1.28
|
|
1.22
|
|
1.26
|
|
1.25
|
|
1.27
|
|
1.29
|
|
1.25
|
|
1.23
|
|
1.26
|
|
1.23
|
|
1.26
|
|
1.23
|
|
1.21
|
|
1.24
|
|
1.23
|
|
1.21
|
|
1.25
|
|
1.26
|
|
1.28
|
|
1.25
|
|
1.22
|
|
1.27
|
|
1.26
|
|
1.22
|
|
1.22
|
|
1.28
|
|
1.25
|
|
1.29
|
|
1.25
|
|
1.29
|
|
1.23
|
|
1.22
|
|
1.29
|
|
1.26
|
|
1.24
|
|
1.29
|
|
1.22
|
|
1.23
|
|
1.26
|
|
1.24
|
|
1.22
|
|
1.28
|
|
1.24
|
|
1.22
|
|
1.25
|
|
1.22
|
|
1.29
|
|
1.21
|
|
1.22
|
|
1.21
|
|
1.27
|
|
1.21
|
|
1.25
|
|
1.23
|
|
1.26
|
|
1.23
|
|
1.29
|
|
1.21
|
|
1.28
|
|
1.28
|
|
1.23
|
|
1.26
|
|
1.26
|
|
1.25
|
|
1.24
|
|
1.21
|
|
1.24
|
|
1.27
|
|
Mean
|
1.25
|
|
Standard Error
|
0.00
|
|
Median
|
1.25
|
|
Mode
|
1.26
|
|
Standard Deviation
|
0.03
|
|
Sample Variance
|
0.00
|
|
Kurtosis
|
-1.11
|
|
Skewness
|
0.24
|
|
Range
|
0.08
|
|
Minimum
|
1.21
|
|
Maximum
|
1.29
|
|
Sum
|
99.67
|
|
Count
|
80
|
|
Largest(1)
|
1.29
|
|
Smallest(1)
|
1.21
|
|
Confidence Level (95.0%)
|
0.01
|
HELPING STUDENTS TO WRITE QUALITY MGMT 650 STATISTICS FOR MANAGERIAL DECISION MAKING ASSIGNMENT AT LOW COST!
9) Interpret the measures of central tendency within the context of this problem. Should the company producing the nails be concerned about the central tendency?
Total sample is 80. The mean length of nails in boxes labled is 1.25 inch and standard deviation is 0.03. The maximum length of nails is 1.29 inch and the minimum length of nails is 1.21. the company should not producing the nails be concerned about variation because its less then ± 10%.
10) Interpret the measures of variation within the context of this problem. Should the company producing the nails be concerned about variation?
Total sample is 80. The mean length of nails in boxes labled is 1.25 inch and standard deviation is 0.03. The maximum length of nails is 1.29 inch and the minimum length of nails is 1.21. The company should or should not producing the nails be concerned about central tendency, its depend upon what average length of nails company wants.There was no sufficients evidence to mate a such statement.
Question 3 -
11) Using the data on the Pivot Table Data Sheet, create a Pivot table showing.
The Type of Movie and the Domestic Gross of each Type; columns D and I on the Pivot Table Data Sheet.
Have three columns: Type, Count of Type, and Sum of Total Domestic Gross.
Format the Domestic Gross Field using $.
|
Type
|
Sum of Total DomesticGross in Millions
|
Count of Type
|
|
SuperHero
|
$2,459,594,075
|
6
|
|
Cartoon
|
$1,634,739,914
|
12
|
|
Drama
|
$1,479,028,725
|
55
|
|
Action
|
$1,269,342,930
|
19
|
|
Comedy
|
$1,148,151,141
|
37
|
|
Sci-Fi
|
$868,541,436
|
13
|
|
Horror
|
$779,935,002
|
14
|
|
Thriller
|
$627,854,287
|
20
|
|
Fantasy
|
$427,793,715
|
4
|
|
Musical
|
$291,335,107
|
2
|
|
Family
|
$246,128,748
|
4
|
|
Documentary
|
$106,445,628
|
10
|
|
Romance
|
$25,937,130
|
2
|
|
Western
|
$3,143,056
|
1
|
|
Unknown
|
$2,999,134
|
1
|
|
Grand Total
|
11370970028
|
200
|
GET READYMADE MGMT 650 STATISTICS FOR MANAGERIAL DECISION MAKING ASSIGNMENT SOLUTIONS - 100% PLAGIARISM FREE WORK DOCUMENT AT NOMINAL CHARGES!
12) Which type of movie had the highest Domestic Gross Total for 2018?
SuperHero
13) Which type of movie had the highest number of films made of that type in 2018?
Drama
(You might try making more/different pivot tables to learn about the raw data. What do you want to know about Domestic Movies in 2018?)
|
Type of movies
|
Sum of # Theaters
|
|
Action
|
54296
|
|
Cartoon
|
37178
|
|
Comedy
|
77368
|
|
Documentary
|
7431
|
|
Drama
|
83576
|
|
Family
|
12031
|
|
Fantasy
|
15337
|
|
Horror
|
37934
|
|
Musical
|
7604
|
|
Romance
|
3600
|
|
Sci-Fi
|
36658
|
|
SuperHero
|
25547
|
|
Thriller
|
45878
|
|
Unknown
|
703
|
|
Western
|
1141
|
|
Grand Total
|
446282
|
14) Use the Data in the Pivot Table Data Sheet to create a Frequency Chart: What is the Total DomesticGross of the lowest movie sales? Hint - use either =MIN()or just choose the movie at the bottom of the list
$2,032,018
What is the Total DomesticGross of the highest movie sales? Hint - use either =MAX()or just choose the movie at the top of the list
$700,059,566
MOST RELIABLE AND TRUSTWORTHY MGMT 650 STATISTICS FOR MANAGERIAL DECISION MAKING ASSIGNMENT HELP & HOMEWORK WRITING SERVICES AT YOUR DOORSTEPS!
15) Subtract the lowest from the highest
The range of Total Domestic Gross for these movies is $698,027,548
16) We will use 10 bins so divide the range by 10: 14621
$69,802,755
Each bin will be: $69,802,755 wide.
Start with the minimum number: $2,032,018
Add the width of the bins $71,834,773
This number is the highest total for the first bin. Put this number is cell C21 for the first bin.
Now add the number that you just put into cell 21 to cell C27. Remember that C13 contains the width of each bin.
The next bin highest number starts with the first bin highest number and adds the size of the bins
Therefore, the second bin begins with $71,834,773 and adds the bin size $69,802,755 to get $141,637,527.60.
Continue adding to get the Bins array for the =FREQUENCY() function.
The last bin number in cell C36 will equal the highest Domestic Gross movie total
17) Here are the highest numbers for each bin:
|
Bins:
|
Frequency:
|
|
$71,834,773
|
162
|
|
$141,637,528
|
16
|
|
$211,440,282
|
10
|
|
$281,243,037
|
6
|
|
$351,045,792
|
2
|
|
$420,848,547
|
1
|
|
$490,651,302
|
0
|
|
$560,454,056
|
0
|
|
$630,256,811
|
1
|
|
$700,059,566
|
1
|
SAVE DISTINCTION MARKS IN EACH MGMT 650 STATISTICS FOR MANAGERIAL DECISION MAKING ASSIGNMENT WHICH IS WRITTEN BY OUR PROFESSIONAL WRITER!
18) Follow the instructions in the youtube videos to use the =FREQUENCY() array function.
You know that you have correctly used the =FREQUENCY() function if Excel automatically puts {} around the function.
Don't forget to push Control-Shift-Enter at the same time to enter the =FREQUENCY function.
|
Bins:
|
Frequency:
|
|
$71,834,773
|
162
|
|
$141,637,528
|
16
|
|
$211,440,282
|
10
|
|
$281,243,037
|
6
|
|
$351,045,792
|
2
|
|
$420,848,547
|
1
|
|
$490,651,302
|
0
|
|
$560,454,056
|
0
|
|
$630,256,811
|
1
|
|
$700,059,566
|
1
|
Copy the Bins and Frequency Data from the Q4 - Frequency sheet
|
Bins:
|
Frequency:
|
|
$71,834,772.80
|
162
|
|
$141,637,527.60
|
16
|
|
$211,440,282.40
|
10
|
|
$281,243,037.20
|
6
|
|
$351,045,792.00
|
2
|
|
$420,848,546.80
|
1
|
|
$490,651,301.60
|
0
|
|
$560,454,056.40
|
0
|
|
$630,256,811.20
|
1
|
|
$700,059,566.00
|
1
|
HIRE PROFESSIONAL WRITER FROM EXPERTSMINDS.COM AND GET BEST QUALITY MGMT 650 STATISTICS FOR MANAGERIAL DECISION MAKING ASSIGNMENT HELP AND HOMEWORK WRITING SERVICES!
19) Histogram - Create a Histogram of the Bins and Frequency data by first creating a column Chart.
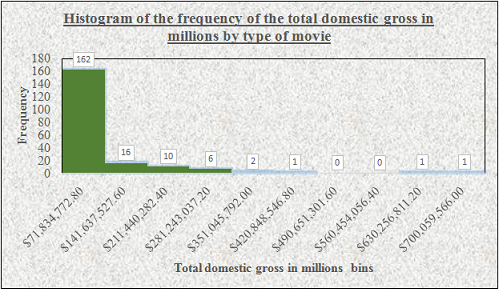
20) Format the historgram so there are no spaces between the bars. Histograms have not spaces and the graph does not become a Histogram until the spaces are removed.
Add a title to the Histogram
Add horizontal and Vertical Axes titles
21) Explain the difference between a histogram and a bar graph:
Barchart represent the groups by categorical variable and histogram represent the group by quantitative variable. Barchart not shows the skewness of the data. But histogram represent the skewness of the data.
22) Make a pie chart of the frequency data with a title and Legend:
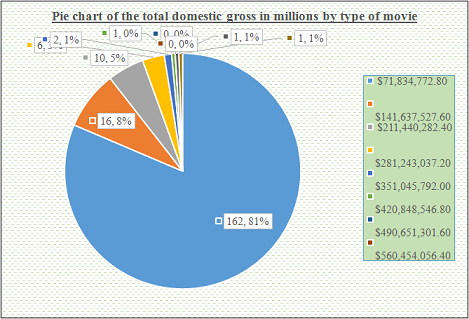
WE HELP STUDENTS TO IMPROVE THEIR GRADES! AVAIL TOP QUALITY MGMT 650 STATISTICS FOR MANAGERIAL DECISION MAKING ASSIGNMENT HELP AND HOMEWORK WRITING SERVICES AT CHEAPER RATE!
Access our Top Quality University of Maryland Global Campus, USA Assignment Help Service for Various Courses and Units, Such As -
- MGMT 610 Organizational Theory Assignment Help
- MGMT 615 Intercultural Communication and Leadership Assignment Help
- MGMT 630 Organizational Theory and Behavior Assignment Help
- MGMT 640 Financial Decision Making for Managers Assignment Help
- MGMT 670 Strategic Management Capstone Assignment Help
- MGMT 650 Statistics for Managerial Decision Making Assignment Help
- EMAN 600 Comprehensive Crisis and Emergency Management Assignment Help
- EMAN 620 Information Technology in Emergency Management Assignment Help
- HSMN 610 Concepts in Homeland Security Assignment Help
- HSMN 630 Resilience Planning and Preparedness for Disaster Response and Recovery Assignment Help
- EMAN 630 Crisis Communication for Emergency Managers Assignment Help
- EMAN 670 Seminar in Emergency Management Leadership Assignment Help