GETTING STUCK WITH SIMILAR IHP 604 HEALTHCARE QUALITY AND IMPROVEMENT ASSIGNMENT? ENROL WITH EXPERTSMINDS'S IHP 604 HEALTHCARE QUALITY AND IMPROVEMENT ASSIGNMENT HELP SERVICES AND GET DISTRESSED WITH YOUR ASSIGNMENT WORRIES!
IHP 604 Healthcare Quality and Improvement - Southern New Hampshire University
Question: Create an Excel file with bar graphs comparing 2016 infection rates (CLABSI, CAUTI, and SSI) against the national hospital benchmark values
Soluiton:
Central line associated bloodstream infections (CLABSI)
|
Procedures
|
CLABSI
|
National Benchmark Hospital Rates
( 11.45% )
|
|
1st quarter (Jan to Mar)
|
10
|
10.99
|
|
2nd quarter (Apr to June)
|
7
|
8.47
|
|
3rd quater (July to Sep)
|
24
|
11.79
|
|
4th quarter (Oct to Dec)
|
21
|
10.19
|
|
Total
|
62
|
41.45
|
|
Comparative Rate
|
17.13%
|
11.45%
|
Table 1: Comparative infection rates of CLABSI with National Benchmark Hospital Rates
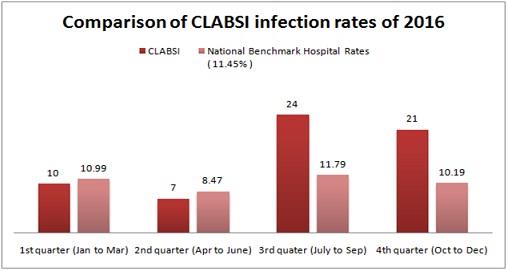
Figure 1: Comparative infection rates of CLABSI with National Benchmark Hospital Rates
According to table 1 and figure 1, the comparative picture of the CLABSI rates is identified with the national benchmark hospital rates for the year 2016. According to the graphical analysis, only in quarter 1 from January to March 2016, the occurrence of CLABSI is lower than the National Benchmark Hospital Rates of 10.99. However, for the next three quarters from April to December 2016, the rate of occurrence has gone up as compared to the national average of 11.45% to 17.13%. The CLABSI rates were at a maximum of 24 as compared to the national benchmark of 11.79 in the third quarter of July to September.
EXPERTSMINDS.COM ACCEPTS INSTANT AND SHORT DEADLINES ORDER FOR IHP 604 HEALTHCARE QUALITY AND IMPROVEMENT ASSIGNMENT - ORDER TODAY FOR EXCELLENCE!
Catheter associated urinary tract infections (CAUTI)
|
Procedures
|
CAUTI
|
National Benchmark Hospital Rates
( 12.34% )
|
|
1st quarter (Jan to Mar)
|
93
|
60.71
|
|
2nd quarter (Apr to June)
|
106
|
61.82
|
|
3rd quarter (July to Sep)
|
72
|
47.63
|
|
4th quarter (Oct to Dec)
|
84
|
30.85
|
|
Total
|
355
|
201.02
|
|
Comparative Rate
|
21.79%
|
12.34%
|
Table 2: Comparative infection rates of CAUTI with National Benchmark Hospital Rates
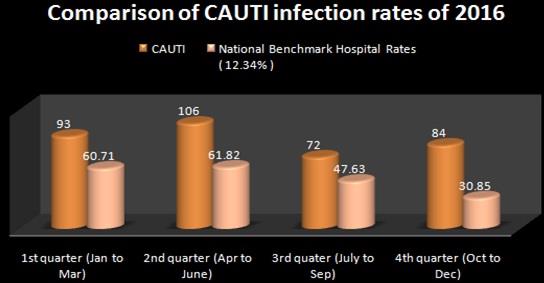
Figure 2: Comparative infection rates of CAUTI with National Benchmark Hospital Rates
According to table 2 and figure 2, the infection rates of CAUTI are analysed comparatively with the actual rates of the year 2016. The CAUTI infection rates were uniformly higher throughout the year if 2016. However, during the second quarter from April to June the infection rates of CAUTI were highest at 106 as compared to the national benchmark of 61.82. The overall rate of CAUTI infections in 2016 was at 21.79% which was higher than the overall national benchmark of 12.34%.
Surgical site infections (SSI)
|
Procedures
|
SSI
|
National Benchmark Hospital Rates
( 13.76% )
|
|
1st quarter (Jan to Mar)
|
7
|
7.57
|
|
2nd quarter (Apr to June)
|
5
|
4.40
|
|
3rd quarter (July to Sep)
|
6
|
3.99
|
|
4th quarter (Oct to Dec)
|
8
|
6.33
|
|
Total
|
26
|
22.29
|
|
Comparative Rate
|
16.05%
|
13.76%
|
WORK TOGETHER WITH EXPERTSMIND'S TUTOR TO ACHIEVE SUCCESS IN IHP 604 HEALTHCARE QUALITY AND IMPROVEMENT ASSIGNMENT!
Table 3: Comparative infection rates of SSI with National Benchmark Hospital Rates
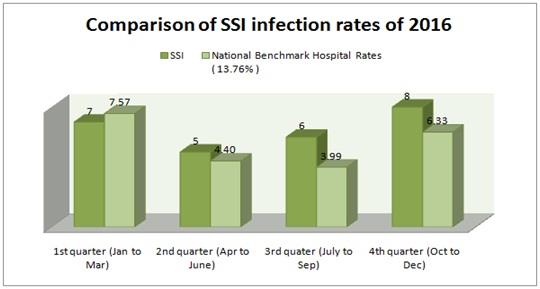
Figure 3: Comparative infection rates of SSI with National Benchmark Hospital Rates
According to table 3 and figure 3, the infection rates of SSI in the year has been compared with the rates of the national benchmark hospital rates. As per the graphical analysis, the occurrence of SSI has been substantially lower in the first quarter from January to March at 7 than the national benchmark hospital rates of 7.57. However, the infection rates have gone up as compared to the national benchmark hospital rates in the next three quarters. On the other hand, the SSI infections were higher at 8 in the last quarter of October to December 2016 as compared to national benchmark hospital rates of 6.33. The national benchmark has not been met in the last three quarters of 2016 as per the SSI infection data.
|
Comparison of infection rates of 2016 with National Benchmark Hospital Rates
|
|
Infections
|
Actual Rate
|
National Benchmark Hospital Rate
|
|
CLABSI
|
17.13%
|
11.45%
|
|
CAUTI
|
21.79%
|
12.34%
|
|
SSI
|
16.05%
|
13.76%
|
Table 4: Comparative analysis
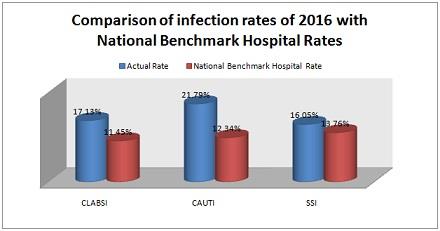
Figure 4: Comparative analysis
According to table 4 and figure 4, the comparative analysis of the SSI, CLABSDI and CAUTI has been performed to obtain and identify whether the national benchmark hospital rates have been adhered to in the year 2016.
Summary response
The value based purchasing or value based reimbursements is highly dependent on the meeting and non meeting of the national benchmark hospital rates (Lloyd et al., 2017). From the above analysis, it may be observed that in most of the cases of CAUTI, SSI and CLABSI the actual infection rates were substantially higher than the national quality benchmarks. The CLABSI was 17.13%, CAUTI at 21.79% and SSI at 16.05% as compared to the national benchmark hospital rates of 11.45%, 12.34% and 13.76% respectively. However, as per the graphical analysis, the actual infection rate of CAUTI was significantly higher as compared to the national benchmark of 12.34% while CLABSI and SSI were not that much higher than their respective national benchmarks. The public healthcare quality improvement is highly dependent on the adherence with the national quality benchmarks
This will significantly affect the value based purchasing or reimbursements as the responsibility of managed care organization have increased for taking care of the patients. On the other hand, the financial risk should be placed on the provider while Patient Centered Medical Homes (PCMH) should be supported with sustainable funding for better patient care (Leonard et al., 2016). While the providers are to be responsible for the cost and quality issues, the patients should be treated to potentially avoid complications (PACs). On following the above mentioned processes, the infection rates may be lowered as per the national quality benchmarks.
ORDER NEW IHP 604 HEALTHCARE QUALITY AND IMPROVEMENT ASSIGNMENT & GET 100% ORIGINAL SOLUTION AND QUALITY WRITTEN CONTENTS IN WELL FORMATS AND PROPER REFERENCING.
Get our Southern New Hampshire University Assignment Help for the below mentioned courses like:-
- IHP 610 Health Policy and Law Assignment Help
- HIM 500 Healthcare Informatics Assignment Help
- OL 665 Leading/Managing Not-For-Profit Orgs Assignment Help
- IHP 501 Global Health and Diversity Assignment Help
- IHP 630 Healthcare Finance and Reimbursement Assignment Help
- IHP 510 Marketing, Communications Strategies and Outreach Assignment Help
- IHP 525 Biostatistics Assignment Help
- OL 600S trategic Human Resource Management Assignment Help
- IHP 620 Economic Principles of Healthcare Assignment Help
- IHP 670 Program Design, Planning and Evaluation Assignment Help