Descriptive Statistics
DO YOU WANT TO EXCEL IN DESCRIPTIVE STATISTICS ASSIGNMENT – ORDER AT EXPERTSMINDS!
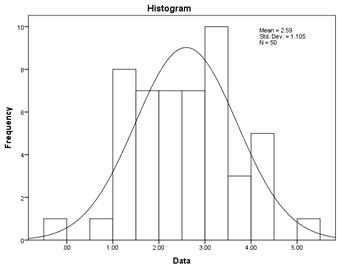
Question 1: Calculate the distribution of the data in the excel file.
Answer: The Descriptive Statistics is given below
|
Descriptives
|
Statistic
|
Std. Error
|
|
Mean
|
2.5919
|
.15630
|
|
95% Confidence Interval for Mean
|
Lower Bound
|
2.2778
|
|
|
Upper Bound
|
2.9060
|
|
|
5% Trimmed Mean
|
2.5934
|
|
|
Median
|
2.5962
|
|
|
Variance
|
1.221
|
|
|
Std. Deviation
|
1.10519
|
|
|
Minimum
|
-.10
|
|
|
Maximum
|
5.13
|
|
|
Range
|
5.23
|
|
|
Interquartile Range
|
1.64
|
|
|
Skewness
|
.018
|
.337
|
|
Kurtosis
|
-.406
|
.662
|
|
Tests of Normality
|
|
Kolmogorov-Smirnova
|
Shapiro-Wilk
|
|
|
Statistic
|
df
|
Sig.
|
Statistic
|
df
|
Sig.
|
|
|
.059
|
50
|
.200*
|
.986
|
50
|
.830
|
|
This is a lower bound of the true significance.
a. Lilliefors Significance Correction
WORK TOGETHER WITH EXPERTSMIND’S TUTOR TO ACHIEVE SUCCESS IN DESCRIPTIVE STATISTICS ASSIGNMENT!
The mean for the sample of 50 observations is 2.592 ± 1.105 (mean ± std dev) and the median value for the sample of 50 observations is 2.596. The median represents the middle value of the dataset and the median value is calculated after arranging the data either in ascending order or descending order of magnitude. The median of 2.596 indicates that about 50% of the sample observation values falls below 2.596 and 50% of the sample observation values fall above 2.596. The minimum and maximum recorded values are - 0.10 and 5.13 respectively. Here, we see that the mean and median value coincides approximately, indicating that the distribution of sample of 50 observations follow normal distribution approximately
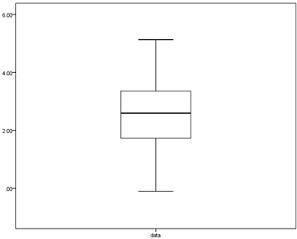
Going through the box plot, we see that the median line (middle line in the box) exactly divides the box into two halves, indicating that the distribution of the sample of 50 observations follow normal distribution
Question 2: The two provided tables below, are the results of a questionnaire-based survey that is repeated twice. The questioner has three questions and total number of respondents are 41. To test questionnaire reliability the survey is repeated twice. Table 1 and 2 indicate the answers of 41 respondents to the questionnaire in two different times. Is the questionnaire reliable?
Answer: The correlation table is given below
|
Correlations
|
SurveyA.Q1
|
SurveyA.Q2
|
SurveyA.Q3
|
SurveyB.Q1
|
SurveyB.Q2
|
SurveyB.Q3
|
|
SurveyA.Q1
|
Pearson Correlation
|
1
|
.851**
|
.859**
|
.848**
|
.799**
|
.860**
|
|
Sig. (2-tailed)
|
|
.000
|
.000
|
.000
|
.000
|
.000
|
|
N
|
41
|
41
|
41
|
41
|
41
|
41
|
|
SurveyA.Q2
|
Pearson Correlation
|
.851**
|
1
|
.856**
|
.816**
|
.914**
|
.884**
|
|
Sig. (2-tailed)
|
.000
|
|
.000
|
.000
|
.000
|
.000
|
|
N
|
41
|
41
|
41
|
41
|
41
|
41
|
|
SurveyA.Q3
|
Pearson Correlation
|
.859**
|
.856**
|
1
|
.882**
|
.869**
|
.944**
|
|
Sig. (2-tailed)
|
.000
|
.000
|
|
.000
|
.000
|
.000
|
|
N
|
41
|
41
|
41
|
41
|
41
|
41
|
|
SurveyB.Q1
|
Pearson Correlation
|
.848**
|
.816**
|
.882**
|
1
|
.771**
|
.889**
|
|
Sig. (2-tailed)
|
.000
|
.000
|
.000
|
|
.000
|
.000
|
|
N
|
41
|
41
|
41
|
41
|
41
|
41
|
|
SurveyB.Q2
|
Pearson Correlation
|
.799**
|
.914**
|
.869**
|
.771**
|
1
|
.903**
|
|
Sig. (2-tailed)
|
.000
|
.000
|
.000
|
.000
|
|
.000
|
|
N
|
41
|
41
|
41
|
41
|
41
|
41
|
|
SurveyB.Q3
|
Pearson Correlation
|
.860**
|
.884**
|
.944**
|
.889**
|
.903**
|
1
|
|
Sig. (2-tailed)
|
.000
|
.000
|
.000
|
.000
|
.000
|
|
|
N
|
41
|
41
|
41
|
41
|
41
|
41
|
Correlation is significant at the 0.01 level (2-tailed).
On looking into the correlation table, if we found that the Pearson Correlation coefficient falls above 0.7 and below 0.8, then, we can say that the reliability is of acceptable reliability. On the other hand, if the Pearson Correlation coefficient falls above 0.8 and below 0.9, then, we can say that the reliability is of good reliability.
EXPERTSMINDS.COM ACCEPTS INSTANT AND SHORT DEADLINES ORDER FOR DESCRIPTIVE STATISTICS ASSIGNMENT – ORDER TODAY FOR EXCELLENCE!