Linear Scheduling Model
GETTING STUCK WITH SIMILAR LINEAR SCHEDULING MODEL ASSIGNMENT? ENROL WITH EXPERTSMINDS'S LINEAR SCHEDULING MODEL ASSIGNMENT HELP SERVICES AND GET DISTRESSED WITH YOUR ASSIGNMENT WORRIES!
Question: Research of Linear Scheduling Model with Varying Production Rates.
Answer: 1. Abstract: The prime factor of linear-scheduling is rate of activity production. Linear project's nature affects the rate of activity production. This paper describes how linear-scheduling depends on production rate's variance. It also elaborates where and when this variance happens or encounters. Visual capabilities are also mentioned. It has two main objectives: first one is to define framework of changes that encounters the production rate. Elaborately, it note when and where the rate of production occurs. Second one is illustrate the easiness and trouble of construction by the use of time-location chart. This paper also describes what the factors are for time and location in respect to future project of construction.
Key features of this model are as follows:-
• It allows estimation of the performance of the assorted routes
• Determine the impact of these routes over the scheduled time frame
• Get through with the barriers prevailing in the project
• Determine the value of the Activity Performance Index (API)
• Use the appropriate color coding in the linear programming chart
• Draw the graph with respect to the time and the expected production rate against the standard production rate
2. Introduction: Gas and oil pipeline construction are the example of linear-construction-project. It occurs in horizontal alignment. Now-a-days bar chart and CPM are also used in such projects. In pipeline-construction, the prime consideration is accuracy and achievement of optimum quality having maximum production-rate rather than the sequence of activity occurrence. There by we are able to draw following conclusion:-
• Rate of production is an important factor in comparison to the repeatability of the process activities.
• The linear scheduling is an effective method to optimize the variables in comparison to the traditional and time taking CPM and bar chart methods
• Even though linear programming holds great importance, but, there is inadequate number of licenses provided by the U.S. for accessing its commercial package
• That's the reason why CPM package has been gaining more popularity in the US market, which has been out looking other methods
• Linear programming is useful in preparing the graphical format allows the task managers, guides, supervisors and venture owners to carry on the project smoothly.
ORDER NEW COPY OF LINEAR SCHEDULING MODEL ASSIGNMENT & GET HIGH QUALITY SOLUTIONS FROM SUBJECT’S TUTORS!
• Rate of assembling is determined by abundant analysis, to check out the alignment, multivariate analysis is used
• In the case of the linear charting, the vertical axis is taken as location and the horizontal axis is taken as the time axis. This graph depicts the rate of production
So via this report we aims to discuss the significance of linear programming, which is effective in determining the rate of production. Further, we'll discuss about the production rate, average production rate, assembly variables and the feasible areas with emphasis over the impact of surface areas like grassland, terrains, etc over the rate of production
3. Primary analysis: Two distinct varieties of linear programming have emerged, namely:
• Location-based/ alignment-based programming
• Repetitive programming
• Under location-based (alignment-based) programming, the examples that fall in are roadways, railways, pipelines, etc. While under the Repetitive programming, examples are multistory houses, buildings, complexes, etc.
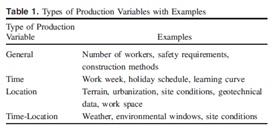
4. Production Variables: Production factors are factors that can influence the generation rates of the development exercises. Albeit numerous factors may impact the genuine Production rates accomplished in the field, they can be isolated into four kinds:
1. General factors: Expansive limitations that influence the generation however are not identified with a particular time or area.
2. Time factors: Factors that change as for time as it were.
3. Area factors: Factors that change concerning area as it were.
4. Time-area factors: Factors that change regarding both time and area.
Table 1 delineates the four sorts of Production factors with instances of basic factors in every class. The following segment expounds on explicit factors that influence generation rates in every one of the four classes.
General Production factors by definition don't change as for time or area. A case of this is the quantity of specialists on the task, which is ordinarily a requirement set by the venture group or potentially the present market demands better accessibility of the product. Besides this, there is a another methodology used for product development, that wipes off the drawbacks associated with the hardware, thereby making it easily approachable
GET ASSURED A++ GRADE IN EACH LINEAR SCHEDULING MODEL ASSIGNMENT ORDER – ORDER FOR ORIGINALLY WRITTEN SOLUTIONS!
The parameters associated with the Production undeniably varies with time, likewise we have to make sure that the production do not drop with the occasions like Christmas and any other season in August, etc. However, there are some other factors associated with it, as follows that affects the production:-
• Poor site condition
• Urbanization
• Calamity
• Climate or natural changes
• Temperature on the shop floor, like in winters performance is better and in summers, working becomes too exhaustive
• Natural windows like from the month from march to July, the development becomes too low.
5. Predicting the trend of altering rates of production via Linear Scheduling Model
Here, LSMVPR is taken into account as the booking model for estimating the altering rates of production. Here, WW follows the format followed under LSMVPR.. Further, time-location chart (TLC) is useful in depicting the change in the area with respect to the time, thereby, the time is quoted against the x-axis and the area is quoted against the y-axis. Thereby, via this time-location chart (TLC), we depict the production rate. Now the thing comes to AWW which stands for arrangement of the working windows that encompasses the arrangement of factors in the homogenous way, which impacts the rate of generation.
In the case of the time-location chart (TLC), if we cut it down in small cells then, each of these cells depicts the working window.
6. LSMVPR Calculations:
Fig. 4 likewise incorporates extra wording in the graph to portray data important for making computations for building up a direct timetable. The measure of the time frame, associated with the working window is called the TR (Time-remaining). Further the lag is depicted by separation time depicted as (DR). Thereby, these two quantities are calculated via following relations:-
DR = WWLE - X ----- (1)
TR = WWTE - Y ----- (2)
The DR and TR are evaluated to determine the parameters via direct planning diagram. Further, there are three associated areas as follows:-
• Top time pivot
• Separation hub
• Convergence of above two OR exit area (DR+ TR)
A variable called remove went in time remaining (DTTR) is presented for deciding the leave area. Eq. (3) is the condition for DTTR,
where PRij = generation rate for the given working window:
DTTR - PR - TR -----(3)
The DTTR can then be compared with the DR to determine the exit location. The following three outcomes can occur:
1. DTTRij = DRij → at the joining of the top time axis and right distance axis, activity present (Fig. 5);
2. DTTRij > DRij → at the right distance axis of the working window, activity present (Fig. 6); or
3. DTTRij < DRij → at the top time axis of the working window, activity present (Fig. 7).
Figs. 5-7 graphically illustrate the three cases.
HELPING STUDENTS TO WRITE QUALITY LINEAR SCHEDULING MODEL ASSIGNMENT AT LOW COST!
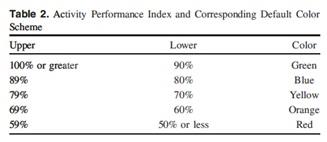
7. Activity Performance Index:
The visual idea of straight booking can be upgraded by adding shading to the individual working windows to give the client extra data about the Production rates anticipated inside each working window. Showing shading in the working windows demonstrates determined execution in respect to the ideal Production rate. The zones troublesome for development would then be able to be effectively decided. The shading added to the working windows is alluded to as the activity execution file (API). The API is a shading plan that demonstrates the status of generation rates on the task. For instance, red demonstrates poor execution, and green shows ideal execution with respect to the ideal Production rate. The shading shows the connection between a client characterized generation rate (PRUD) and the determined Production rate, which is a no doubt rate dependent on verifiable information.
Table 2 delineates the default rates for relegating shading dependent on Production execution. To infer the rates, the client decides a dimension of generation wanted for the given movement. At each working window, a Production rate is resolved dependent on LSMVPR.
Abbreviation used:
CPM: Critical Path Method
TLC: time-location chart
WW: working window
SAVE DISTINCTION MARKS IN EACH LINEAR SCHEDULING MODEL ASSIGNMENT WHICH IS WRITTEN BY OUR PROFESSIONAL WRITER!