HI6007 Statistics And Research Methods For Business Decision Making, Holmes Institute, Australia
Title: Group Assignment
ARE YOU LOOKING FOR RELIABLE HI6007 STATISTICS AND RESEARCH METHODS FOR BUSINESS DECISION MAKING ASSIGNMENT HELP SERVICES? EXPERTSMINDS.COM IS RIGHT CHOICE AS YOUR STUDY PARTNER!
Question 1: Answer the questions below:
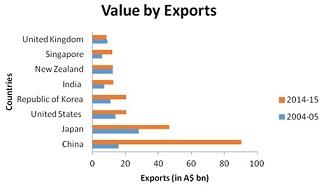
(a) Use an appropriate graphical technique to compare the value of Australian exports (in A$bn) in 2004-05 and 2014-15, broken down by country of export destination.
Answer: Australian exports in value terms for 8 countries is as follows:
(b) Use an appropriate graphical technique to compare the percentage value of Australian exports (in %) in 2004-05 and 2014-15, broken down by country of export destination.
Answer: Australian exports in percentage terms for 8 countries is as follows:
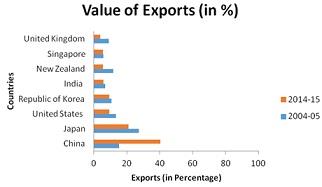
(c) Comment your observations in parts (a) and (b).
Answer: There is a minor difference in both value wise as well as percentage wise in the Australian exports to the eight countries. The highest export by Australia is made to China both in value as well as percentage wise in 2014-15 and to Japan in 2004-05. The minimum exports belong to Singapore in 2004-05 and United Kingdom in 2014-15.
Question 2: Answer the questions below:
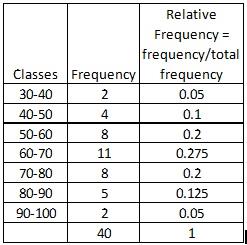
a. Construct a frequency distribution and a relative frequency distribution for the data.
Answer: The frequency and relative frequency table:
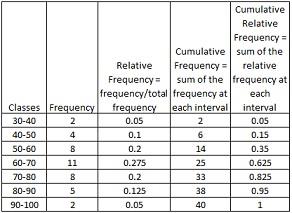
b. Construct a cumulative frequency distribution and a cumulative relative frequency distribution for the data.
Answer: The cumulative and cumulative relative frequencies are as follows:
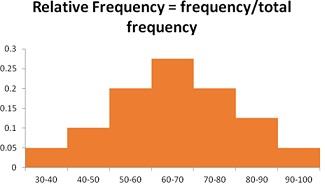
c. Plot a relative frequency histogram for the data.
Answer: The histogram is as follows:
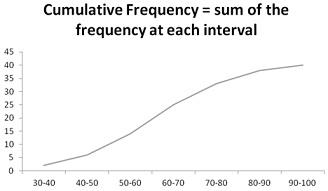
d. Construct an ogive for the data.
Answer: The ogive is as follows:
e. What proportion of the grades is less than 60?
Answer: Proportion of grades less than 60 is the cumulative score till 50-60 divided by the total frequency. Hence: 14/40 * 100 = 35% of the grades are less than 60.
f. What proportion of the grades is more than 70?
Answer: Proportion of the grades more than 70 is sum of frequency for 70-80, 80-90 and 90-100 divided by total frequency. Hence: (8+5+2)/40*100=37.5% of the grades are above 70.
NEVER LOSE YOUR CHANCE TO EXCEL IN HI6007 STATISTICS AND RESEARCH METHODS FOR BUSINESS DECISION MAKING ASSIGNMENT - HIRE BEST QUALITY TUTOR FOR ASSIGNMENT HELP!
Question 3: Answer the questions below:
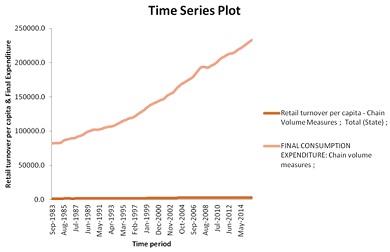
a. Using an appropriate graphical descriptive measure (relevant for time series data) describe the two variables.
Answer: The graphical measure to be used in analyzing time series is line chart only.
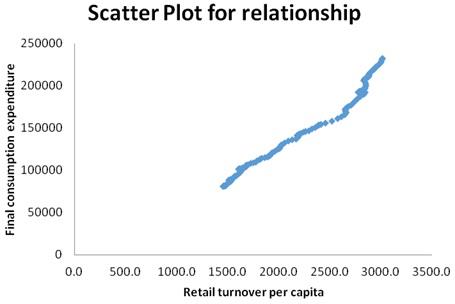
b. Use an appropriate plot to investigate the relationship between FINAL CONSUMPTION EXPENDITURE and RETAIL TURNOVER PER CAPITA. Briefly explain the selection of each variable on the X and Y axes and why?
Answer: Scatter diagram is the apt plot to show relationship between the two variables. On the horizontal axis, we take retail turnover per capita which causes a change in the final consumption expenditure and hence, final consumption expenditure is taken on the vertical axis.
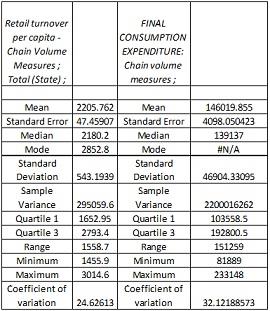
c. Prepare a numerical summary report about the data on the two variables by including the summary measures, mean, median, range, variance, standard deviation, coefficient of variation, smallest and largest values, and the three quartiles, for each variable.
Answer: The summary statistics define the location and spread of the variables:
d. Calculate the coefficient of correlation (r) between FINAL CONSUMPTION EXPENDITURE and RETAIL TURNOVER PER CAPITA. Then, interpret it.
Answer: 98.769% is the correlation coefficient signifying a higher degree of correlation between the two variables i.e. retail turnover per capita and final consumption expenditure. Also, positive correlation signifies the fact that as the independent variable increases, the dependent variable will increase too.
e. Estimate a simple linear regression model and present the estimated linear equation. Then, interpret the coefficient estimates of the linear model.
Answer: The regression model is:
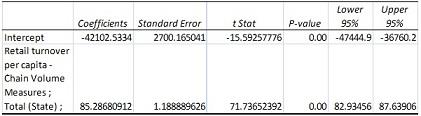
The equation is as follows:
Final consumption expenditure = -42102.5334+85.286*Retail turnover per capita
The intercept coefficient has no significance and that of retail turnover per capita signifies that as it increases by 1 unit, the value of final consumption expenditure will increase by 85.286 times.
GET ASSURED A++ GRADE IN EACH HI6007 STATISTICS AND RESEARCH METHODS FOR BUSINESS DECISION MAKING ASSIGNMENT ORDER - ORDER FOR ORIGINALLY WRITTEN SOLUTIONS!
f. Determine the coefficient of determination R2 and interpret it.
Answer: The coefficient of determination is 0.9755 and is shown as follows:
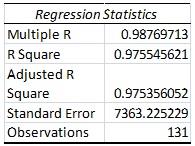
97.55% of the variation in final consumption expenditure is explained by the variable included in the model i.e. retail turnover per capita.
g. Test whether FINAL CONSUMPTION EXPENDITURE positively and significantly increases with RETAIL TURNOVER PER CAPITA at the 5% significance level.
Answer: In order to check the correlation between the two at 5% level of significance, we will check the anova test.
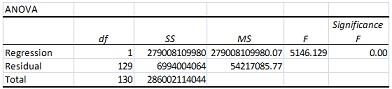
The p value of F test is 0.00. Since, p value is less than 5% level of significance; this means that the final consumption expenditure positively and significantly increases with retail turnover per capita.
h. What is the value of the standard error of the estimate (se). Then, comment on the fitness of the linear regression model?
Answer: The standard error is 7363.225 which is very high and indicates that the model is not fit at all.
Connect With Our Professionals Today And Avail Top-Scores In Your Assessments, We Proffer Perfect Holmes Institute, Australia Assignment Help Services For Different Courses And Units, Such As -
- HI5004 - Marketing Management Assignment Help
- HI6005 - Management and Organisations in a Global Environment Assignment Help
- HI6006 - Competitive Strategy Assignment Help
- HI6008 - Business Research Assignment Help
- HI5009 - Leading and Managing People and Relationships for Performance Assignment Help
- HI5010 - Innovation and Entrepreneurship Assignment Help
- HI6011 - Leveraging Information Technology for Business Advantage Assignment Help
- HI6012 - Managing Operations and Supply Chains Assignment Help
- HI5013 - Managing Across Borders Assignment Help
- HI5014 - International Business Across Borders Assignment Help