Environmental Impact, Federation University, Australia
ITECH7406 - Business Intelligence and Data Warehousing
ARE YOU LOOKING FOR RELIABLE ENVIRONMENTAL IMPACT ASSIGNMENT HELP SERVICES? EXPERTSMINDS.COM IS RIGHT CHOICE AS YOUR STUDY PARTNER!
Executive Summary: In this report we are going to discuss about climate change. There are various reason that will impact on environment change and this will may lead to climate changes. The pollution is a major reason that will effect on environment. There are many type of pollution like noise pollution, air pollution and other reason of pollution is waste product. In this paper we are study waste product and air aviation that is increased the pollution. The air aviation is increasing the noise and air pollution. This may lead the environment change and this is a global warming. In this assignment we study and analysis the world bank data and analysis the data with the help of SAP BI analytical tools.
In this paper we working on Big data and applied the data sets whose size or type is beyond the ability the traditional relational databases to capture, manage, and process the data with low-latency. Firstly we discuss about the waste material. We are discussing about waste material that increased the pollution and impact on environment change This waste product pollution effect the greenhouse gasses that will main reason for climate change.
We are discussing about waste product that are generated due to various reason. We are discussing the rubbish waste types .
firstly we discuss about the Recyclable rubbish. Recycle material used again and again it called be recycled. This material can be used after some modification and it work like new.
second one is solid rubbish. solid rubbish waste is produce in home and industries. it is divide into several categories.third one is Tins and Metal. we can see in houses.The mostly house hold tool and utensils are made to tins and metals. the aluminum foil are used keep the fresh food .
the next is plastic waste. people are used the plastic things that is polyethene e it is also used for packing. the problem is non-biodegradable. We can't dispose it and it take many year to decompose.
Why SAP BI Tool?
SAP BI Analytics tool is combination of the machine learning (ML) and artificial intelligence (AI). SAP BI Tool Analytics are very helpful for users who are new to analytics and to seasoned business analysts who would rather focus on getting rapid feeds of insights rather than on how the data is clean for analysisSAP BI Tool Analytics working with numerous databases as follows:
1. Cloudera
2. Impala
3. Microsoft Azure
4. MySQL
5. Oracle
6. PostgreSQL
7. PostgreSQL
8. Structured Query Language (SQL) Server, Sybase,
9. Sybase IQ
10. Teradata.
This is self-service BI tool, and compliance and security rules are set according to business requirement. The BI tool is help full for company or user easily loads data. The BI tool helping to clients for setting rules according to their requirement.
The BI tool provide the feature shape and cleanse the data and before uploading using Shape Before button after the we can upload the data for analytical work using the Upload now or we can use New Data Button for upload the data.
The Shape Before button helps us for easily clean and prepared the data with clicks and then we use analytical tool on clean data.
The dashboard displays the data sets where we can choice data of icons or a table. The SAP BI Tool Analytics, data can be refreshed frequently, as often as every 5 seconds.
DASHBOARD
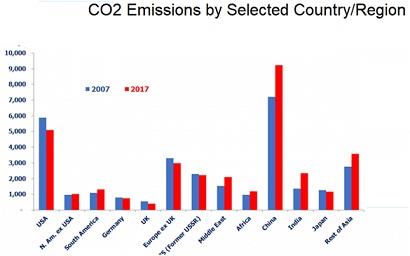
In this paper we are analysis the information in below graphs. In this section we are going to discuss the environment changes due to waste product and that will impact to environment change and due to these waste product pollutions rapidly increase.. This table is showing the information
Current C02 Emission. This table is show, top ten countries for current CO2 emission .In current scenario China is in the top for green house emission ; can say most polluted country. This table is reflect the US having second rank in air pollutions. Now other developing country India is third rank is in pollution spread. This table reflect , in current scenario developing countries is not take care about the reason of pollution .According to world current scenario 10 rank is Saudi Arabia .
1. China: 9697 million tonnes (MT) or 28.6%
2. US: 5420 MT or 16.0%
3. India: 1967 MT or 5.8%
4. Russia: 1829 MT or 5.4%
5. Japan: 1243 MT or 3.7%
6. Germany: 810 MT 2.4%
7. South Korea: 609 MT or 1.7%
8. Canada: 555 MT or 1.6%
9. Indonesia: 490 MT or 1.4%
10. Saudi Arabia: 464 MT or 1.4%
NEVER LOSE YOUR CHANCE TO EXCEL IN ENVIRONMENTAL IMPACT ASSIGNMENT - HIRE BEST QUALITY TUTOR FOR ASSIGNMENT HELP!
We are discussing in this table about per-person CO2 emissions .According to table Qatar is top rank in CO2 emission from fossil fuels in 2010. This table reflect the Ethiopia is 10th rank in CO2 emission from fossil fuels 2010.
Qatar: 36.9 tonnes
United States: 17.3 tonnes
Australia: 17.0 tonnes
Russia: 11.6 tonnes
Germany: 9.3 tonnes
UK: 7.8 tonnes
China: 5.4 tonnes
World average: 4.5 tonnes
India: 1.4 tonnes
Africa average: 0.9 tonnes
Ethiopia: 0.1 tonnes
This table is shown the information about air pollution information and showing the health risk due to pollutant.
|
Air pollutants
|
|
pollutant
|
common factor for pollution
|
Max acceptable concentration in the atmosphere
|
Risks on environment
|
Risks on human health
|
| |
|
carbon monoxide (CO)
|
automobile emissions, fires, industrial processes
|
35 ppm (1-hr ); 9 ppm (8-hr )
|
contributes to smog formation
|
exacerbates symptoms of heart disease, such as chest pain; may cause vision problems and reduce physical and mental capabilities in healthy people
|
|
NO and NO2)
|
automobile emissions, electricity generation, industrial processes
|
0.053 ppm
(one year)
|
damage to foliage; contributes to smog formation
|
inflammation and irritation of breathing passages
|
|
(SO2)
|
electricity generation, fossil-fuel combustion, industrial processes, automobile emissions
|
0.03 ppm (one year ); 0.14 ppm (one day)
|
major cause of haze; contributes to acid rain formation, which subsequently damages foliage, buildings, and monuments; reacts to form particulate matter
|
breathing difficulties, particularly for people with asthma and heart disease
|
|
ozone (O3)
|
nitrogen oxides (NOx) and volatile organic compounds (VOCs) from industrial and automobile emissions, gasoline vapours, chemical solvents, and electrical utilities
|
0.075 ppm (8-hr)
|
interferes with the ability of certain plants to respire, leading to increased susceptibility to other environmental stressors
|
reduced lung function; irritation and inflammation of breathing passages
|
|
particulate matter
|
sources of primary particles include fires, smokestacks, construction sites, and unpaved roads; sources of secondary particles include reactions between gaseous chemicals emitted by power plants and automobiles
|
150 μg/m3 (one day period for particles <10 μm); 35 μg/m3 (one day period for particles <2.5 μm)
|
contributes to formation of haze as well as acid rain, which changes the pH balance of waterways and damages foliage, buildings, and monuments
|
irritation of breathing passages, aggravation of asthma, irregular heartbeat
|
|
lead (Pb)
|
metal processing, waste incineration, fossil-fuel combustion
|
0.15 μg/m3 (rolling three-month average); 1.5 μg/m3(quarterly average)
|
loss of biodiversity, decreased reproduction, neurological problems in vertebrates
|
adverse effects upon multiple bodily systems; may contribute to learning disabilities when young children are exposed; cardiovascular effects in adults
|
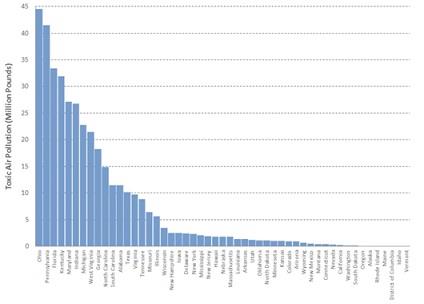
According to analysis Maryland and New Hampshire is very air polluted states and percentage is 91 to 96. Texas and Illinoisis low air polluted states.
We analysis using BI analytical tool and discuss about why the pollution is increased rapidly. There are various factors that is impact on greenhouse level gases. We are discuss about the why the climate change or global warming. There are different type of pollutionstransportations, water, air and noise pollutions.
These pollutions impact on environment.
This table is showing the information about the most polluted state per 100,000 people:
Air pollution (ug/m3):
|
Rank State Pollution Information
15 North Carolina Air pollution : 12.99
Cancer diagnoses 448.8
14. South Carolina Air pollution (ug/m3): 13.16
Cancer diagnoses 433.3
13. Mississippi Air pollution : 13.16
Cancer diagnoses 462.1
12. Virginia Air pollution : 13.26
Cancer diagnoses per 416.5
11. Georgia Air pollution : 13.3
Cancer diagnoses 453.4
10. Pennsylvania Air pollution : 13.35
Cancer diagnoses 477.3
9. Illinois Air pollution : 13.38
Cancer diagnoses 460.4
8. Maryland Air pollution : 13.47
Cancer diagnoses 439.5
7. Washington, D.C. Air pollution : 13.58
Cancer diagnoses 442.4
6. West Virginia Air pollution : 13.76
Cancer diagnoses 461
5. Alabama Air pollution : 13.95
Cancer diagnoses 437.9
4. Tennessee Air pollution : 14.02
Cancer diagnoses 445.7
3. Kentucky Air pollution : 14.1
Cancer diagnoses 513.7
2. Ohio Air pollution: 14.23
Cancer diagnoses 452.1
1. Indiana 14.36
Cancer diagnoses 435.8
|
This table is showing the information Percent Change in Emissions. We are showing in this table we are showing year wise emission information.
|
Percent Change in Emissions
|
|
1981 vs 2016
|
1991 vs 2016
|
2001 vs 2016
|
2010 vs 2016
|
|
-71
|
-65
|
-52
|
-19
|
|
-99
|
-80
|
-50
|
-23
|
|
-61
|
-58
|
-52
|
-28
|
|
-54
|
-40
|
-19
|
-8
|
|
-61
|
-25
|
-22
|
-12
|
|
---
|
-29
|
-37
|
-11
|
|
-89
|
-88
|
-83
|
-64
|
|
Rank according to emissions
|
Country
|
Total CO2 emissions from fuel combustion (million metric tons)
|
CO2 emissions from fuel combustionper capita (metric tons)
|
|
1
|
China
|
9040.74
|
6.59
|
|
2
|
United States
|
4997.50
|
15.53
|
|
3
|
India
|
2066.01
|
1.58
|
|
4
|
Russia
|
1468.99
|
10.19
|
|
5
|
Japan
|
1141.58
|
8.99
|
|
6
|
Germany
|
729.77
|
8.93
|
|
7
|
South Korea
|
585.99
|
11.58
|
|
8
|
Iran
|
552.40
|
6.98
|
|
9
|
Canada
|
549.23
|
15.32
|
|
10
|
Saudi Arabia
|
531.46
|
16.85
|
|
11
|
Brazil
|
450.79
|
2.17
|
|
12
|
Mexico
|
442.31
|
3.66
|
|
13
|
Indonesia
|
441.91
|
1.72
|
|
14
|
South Africa
|
427.57
|
7.77
|
|
15
|
United Kingdom
|
389.75
|
5.99
|
|
16
|
Australia
|
380.93
|
15.83
|
|
17
|
Italy
|
330.75
|
5.45
|
|
18
|
Turkey
|
317.22
|
4.10
|
|
19
|
France
|
290.49
|
4.37
|
|
20
|
Poland
|
282.40
|
|
CO2 and H2O are main two gases those impact on environment change and these are a primary factor. carbon dioxide into the atmosphere: 10 companies are responsible for 71% of GHG emissions .In this table we are showing the information about the pollution percentage. The top most is china coal industry ,who is producing highest pollution in the world.
China Coal 14.29 %
Saudi Aramco 4.49 %
Gazprom OAO 3.89 %
National Iranian Oil Co 2.29 %
ExxonMobil Corp 2.09 % "
Coal India 1.9 %
PetróleosMexicanos 1.9 %
Russia Coal 1.9 %
Royal Dutch Shell PLC 1.7 %
China National Petroleum Corp 1.6 %
The 56 countries included in the ranking were found to be responsible for about 90% of global greenhouse gas emissions
17. France - 59.30
16. Romania - 59.42
15. Luxembourg - 59.92
14. Ukraine - 60.09
13. Portugal - 60.54
12. Denmark - 61.96
11. Croatia - 62.39
10. Finland - 62.61
9. Norway - 62.80
8. India - 62.93
7. Malta - 65.06
6. Switzerland - 65.42
5. United Kingdom - 65.92
4. Latvia - 68.31
3. Lithuania - 70.47
2. Morocco - 70.48
1. Sweden - 76.28
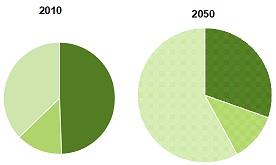
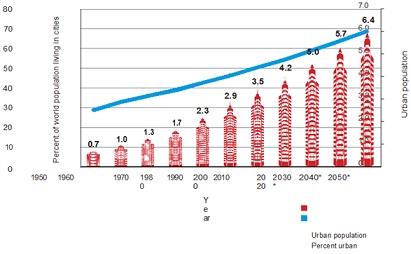
These chart is showing the information about share of urban and rural pollution in 2010 to 2050.
Share of Urbanand Rural Population in 2010 and 2050
|
Forcing Agent
|
Approximate Removal Times 3
|
Climate Forcing (W/m2) Up to the year 2000
|
|
Greenhouse Gases
|
|
|
|
Carbon Dioxide
|
>100 years
|
1.3 to 1.5
|
|
Methane
|
10 years
|
0.5 to 0.7
|
|
Tropospheric Ozone
|
10-100 days
|
0.25 to 0.75
|
|
Nitrous Oxide
|
100 years
|
0.1 to 0.2
|
|
Perfluorocarbon
Compounds
(Including SF6)
|
>1000 years
|
0.01
|
|
Fine Aerosols
|
|
|
|
Sulfate
|
10 days
|
-0.3 to -1.0
|
|
Black Carbon
|
10 days
|
0.1 to 0.8
|
GET ASSURED A++ GRADE IN EACH ENVIRONMENTAL IMPACT ASSIGNMENT ORDER - ORDER FOR ORIGINALLY WRITTEN SOLUTIONS!
This graph is showing the information about harm full air how this is going increase and it can effect to climate change.
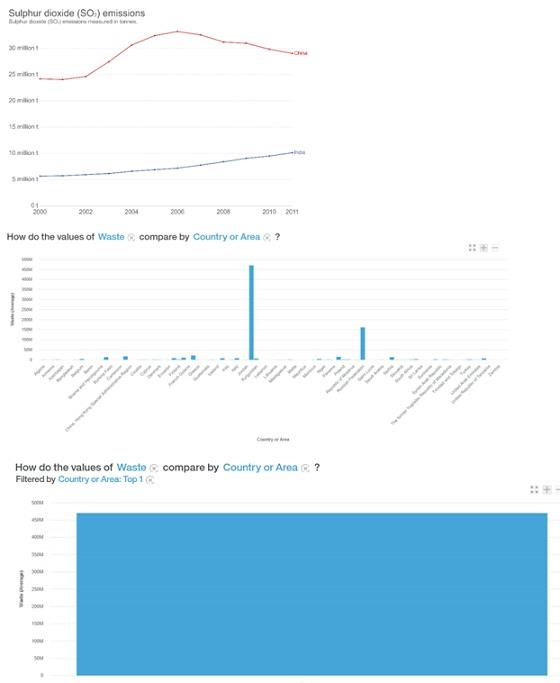
In this graph we are showing the information top country in producing hazardous waste. According to graph top country is Kazakhstan which produces the maximum waste
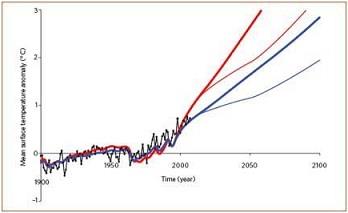
This is showing the information temperature and climate sensitivity.According the our analysis past three decade CO2 only causes 35% of global warming and other species total global warming more than 64 %/
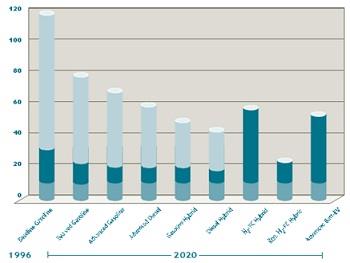
This graph is showing information about pollution information
The graph shows us the total number of hazardous waste produced . The amount of waste produced is 12107777 Tons.
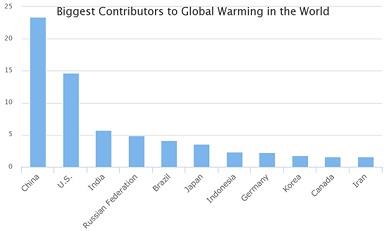
Well-to-Wheel Carbon Emissions
|
Rank
|
Country
|
share of global CO2 emissions
|
|
1
|
China
|
23.43 %
|
|
2
|
U.S.
|
14.69 %
|
|
3
|
India
|
5.70 %
|
|
4
|
Russian Federation
|
4.87 %
|
|
5
|
Brazil
|
4.17 %
|
|
6
|
Japan
|
3.61 %
|
|
7
|
Indonesia
|
2.31 %
|
|
8
|
Germany
|
2.23 %
|
|
9
|
Korea
|
1.75 %
|
|
10
|
Canada
|
1.57 %
|
|
11
|
Iran
|
1.57 %
|
NO PLAGIARISM POLICY - ORDER NEW ENVIRONMENTAL IMPACT ASSIGNMENT AND GET WELL WRITTEN SOLUTIONS DOCUMENTS WITH FREE TURNTIN REPORT!
Conclusion: In this paper we studied and analyzed pollution and their effect .We study the data set from Kaggle website that is in the form of csv file. We download the data and using BI tool we complete the analysis . These analysis is based on Climate change actor. As per our analysis top ranking state is Indiana in the term of air pollution. As we focus on pollution factor NO2 ,O3 . We find top most ranking in pollution state is Ohio. These factor are showing pollution is increasing and pollution increasing due to various factor .Our data set is more focus data set hence we got more relevant result in the term of prediction. Our prediction is based on BI tool. Our BI tool is easy to use and basic . This tool having a GUI interface and hence working on this tool is easy . The first step is load the data and then just pressing the few button we gather the result about our data set. According to our analysis the Day by day it's bad effects are increasing and so on causing more problems for us. Climate change is very harmful for us. It's harmful for our present and future. So we should take measure steps to reduce it. As we analysis the data we find out the Power-plant of U.S.A is responsible for the 12% of total Climate change is caused by increase in emission, noise pollution and It causes problems in human's life like health problems, Water balance ,climate change etc. . According to analysis there are numerous premature deaths due to the pollution It can be prevented by using bio fuel . "MAKE EARTH free from pollution " .
In this paper, we summarized analysis using BI analytical tool and discussed about why the pollution is increased rapidly. There were various factor that is impact on greenhouse level gases. We analyzed about the why the climate change or global warming. We discussed about pollution using Graph , these graph are develop using by BI tool and This BI tool is helpful about analysis. Our analysis is based on gathered data. The people life span is reduce due to environmental changes and premature death ratio is rising day by day due to pollution or climate change. The numerous disease are increasing due to pollution. According to our analysis developing countries are not take care causes of pollution increasing . Our suggestion is there is a need of law to prevent the pollution problem. There is need to impose the penalty on industries those are responsible for generating pollutions.
Recommendation:
Letter to CEO
To
The CEO
......
..........
May 30 , 2019
Sub : Climate Change
Sir ,
I wish to draw the attention of the authorities
Today, as we know Climate change is very harmful for us. It's harmful for our present and future. So we should take measure steps to control it. As we analysis the data we find out the Power-plant of U.S.A is responsible for the 12% of total Climate change is caused by increase in emission, noise pollution and It causes problems in human's life like health problems, Water balance ,climate change etc. .
According to analysis there are numerous premature deaths due to the pollution It can be prevented by using bio fuel . "MAKE EARTH free from pollution " . The authority should also pay attention by making various awareness programmers ,time to time.
I wish authority will to do something to regular Air Pollution
Thanks and Regards
A b c
A x x
Below we have listed the major courses and academic units that we cover within our Federation university assignment help service -
- ITECH7408 - Social Media Strategy & Management Assignment Help
- ITECH7409 - Software Testing Assignment Help
- ITECH7413 - Supply Chain Operations And Management Assignment Help
- ITECH7415 - Masters Project Assignment Help
- ITECH7602 - Project Assignment Help
- ITECH7606 - Electronic Commerce Management Assignment Help
- ITECH7607 - Electronic Commerce Security Assignment Help
- ITECH7608 - Artificial Neural Networks Assignment Help
- ITECH7609 - Genetic Algorithms Assignment Help
- ITECH7610 - Research Project & Thesis Assignment Help