Assignment - Benchmark - Descriptive Statistics Project
GETTING STUCK WITH SIMILAR DESCRIPTIVE STATISTICS PROJECT ASSIGNMENT? ENROL WITH EXPERTSMINDS'S DESCRIPTIVE STATISTICS PROJECT ASSIGNMENT HELP SERVICES AND GET DISTRESSED WITH YOUR ASSIGNMENT WORRIES!
Find the appropriate measure of center. Discuss why the chosen measure is most appropriate. Why did you decide against other possible measures of center?
Find the appropriate measure of variation. The measure of variation chosen here should match the measure of center chosen in Part 1.
Find the graph(s) needed to appropriately describe the data. These may be done by hand and inserted into the Word document.
Define a random variable (X) so that your chosen data set represents values of X.
Is your chosen random variable discrete or continuous? Explain how you know.
Would the Normal or Binomial distribution be a good fit for the underlying sample distribution of X? If one of them is a good fit, state how you would approximate the distribution parameters.
Calculate the probability that a flight will depart early or on-time.
Calculate the probability that a flight will arrive late.
Calculate the probability that a flight departs late or arrives early.
Answer - Report
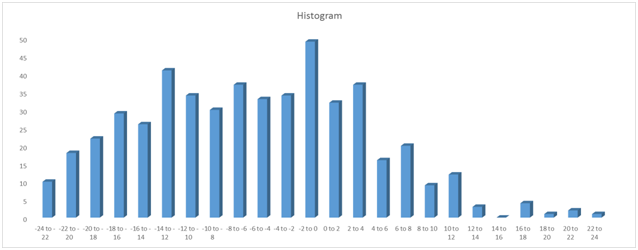
The variable taken into consideration is DEP_DELAY, and it represents the time duration which is calculated by subtracting scheduled time from actual departure time. If the departure time is early than the scheduled time, then the difference is negative. The descriptive statistics is given below
|
DEP_Delay
|
|
Mean
|
-5.296
|
|
Standard Error
|
0.411966261
|
|
Median
|
-5
|
|
Mode
|
0
|
|
Standard Deviation
|
9.211845646
|
|
Sample Variance
|
84.8581002
|
|
Kurtosis
|
-0.447743138
|
|
Skewness
|
0.208172375
|
|
Range
|
47
|
|
Minimum
|
-24
|
|
Maximum
|
23
|
|
Sum
|
-2648
|
|
Count
|
500
|
NEVER BE CAUGHT IN PLAGIARISM, AVAIL DESCRIPTIVE STATISTICS PROJECT ASSIGNMENT HELP SERVICE OF EXPERTSMINDS.COM AND SAVE HIGHER MARKS!
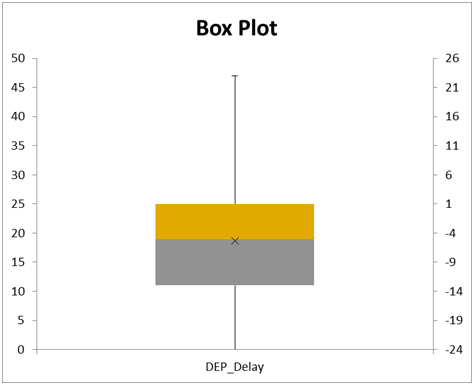
The mean difference in time which is calculated by subtracting scheduled time from actual departure time is - 5.296 minutes with a standard deviation of 9.212 minutes. The mean difference in time which is calculated by subtracting scheduled time from actual departure time is - 5 minutes. Here, we see that the mean departure time difference is greater than the median departure time and therefore, we can say that the distribution violates the assumption of normality. When the distribution follows normal, then mean is the appropriate central tendency measure. On the other hand, when the distribution is skewed, then mean is highly affected by outliers and therefore, median is the best central tendency measure
Thus, we can use median and interquartile range as the central tendency and variation measures respectively for non-normally distributed variables.
Here, the random variable X represents the time duration which is calculated by subtracting scheduled time from actual departure time
The variable is continuous
Since the variable taken into consideration is continuous variable, the normal distribution would be the appropriate distribution for this random variable
About 327 out of 500 samples showed early departure. That is the probability of early departure 0.654
About 209 out of 500 samples showed late arrival. That is the probability of late arrival is 0.418
About 34 out of 500 flights that departs late and arrives early, that is, the probability of flights that depart late and arrive early is 0.068
Flight Arrival
The mean difference in time between which is calculated by subtracting scheduled time from actual departure time is - 3.138 minutes with a standard deviation of 9.66 minutes. The mean difference in time which is calculated by subtracting scheduled time from actual departure time is - 2 minutes. Here, we see that the mean arrival time difference is greater than the median arrival time and therefore, we can say that the distribution violates the assumption of normality. When the distribution follows normal, then mean is the appropriate central tendency measure. On the other hand, when the distribution is skewed, then mean is highly affected by outliers and therefore, median is the best central tendency measure
ORDER NEW COPY OF DESCRIPTIVE STATISTICS PROJECT ASSIGNMENT AND SECURE HIGHER MARKS!
Thus, we can use median and interquartile range as the central tendency and variation measures respectively for non-normally distributed variables
From the information given, it is found that the mean arrival time of flight is - 2.5 with a standard deviation of 23. This indicates that, on an average, the flight arrives 2.5 units earlier when compared with the scheduled time. In order to determine the probability of flights that arrived late, we need to find P (X > 0)
P(X>0) = 1-P((x-μ)/σ<(0-(-2.5))/23)
=1-P(Z<(0-(-2.5))/23),where z=(x-μ)/σ~N(0,1)
= 1 - P (Z < 0.109)
= 0.457 (by referring normal distribution table)
Thus, we see that the probability of flights arriving late is 0.457, that is, 45.7% of the flights arriving late. This result closely matches with the result given in part 8 which says that the probability of late arrival is 0.418 and therefore we can say that there is no difference in the results obtained.
EXPERTSMINDS.COM GIVES ACCOUNTABILITY OF YOUR TIME AND MONEY - AVAIL TOP RESULTS ORIGINATED DESCRIPTIVE STATISTICS PROJECT ASSIGNMENT HELP SERVICES AT BEST RATES!