ORDER NEW COPY OF BIG DATA AND ANALYTICS ASSIGNMENT & GET HIGH QUALITY SOLUTIONS FROM SUBJECT'S TUTORS!
ITECH1103 Big Data and Analytics - Federation University
Write a data analytical report to provide useful insights, pattern and trends in the chosen/given dataset.
Executive Summary
The report will describe the importance of the Data analytics to the U.S department of Health and social care which can be utilized and stored in various tools which helps in extracting confidential information at the right time. The data set will help in making the Government aware of the healthstandardthat must be improved to make a difference in the common people life. The use of BI Analytical tool, will help in understanding the use of data and storing them in making changes in the organization. A set of data set will also be analyzed which will be taken from the Teradata university page.
Introduction
Data analytics can be considered as the umbrella of various information, as they are stored and restored in the development of the organization. The organization by the use of the data can help in utilizing the necessities of the organization and implement the data in better improvement of the functionalities of the organization. This record keeping system will be analyzed by the help of the business tool which is the most used tool in data protection in the business world. The use of SAS analytics will help in understanding the record keeping of data and the utilization in the practical field. Therefore, 20 set of questions will be answered along with the description of data set suppoerted by visualization built in the bi tool. This will eventually helps the U.S government in making changes to the health departments and organizations to serve better to the common people of America.
ENROL WITH BIG DATA AND ANALYTICS ASSIGNMENT HELP AND HOMEWORK WRITING SERVICES OF EXPERTSMINDS.COM AND GET BETTER RESULTS IN BIG DATA AND ANALYTICS ASSIGNMENTS!
Task 1
Write a description of the dataset and project, and its importance for the organization. Discuss the main benefits of using visual analytics to explore big data. In this you should include a justification for using the visualizations that you will use and how they have been successful in other similar projects. This discussion should be suitable for a general audience.
Solution:
Background Information
This part of the report, will enunciate the type of dataset used here to analyses the process of record keeping and the utilization it has to each hospital and care providing organizations. The data set consists of information having many tuples which consists of various components. It can be represented in tabular for, or visualization or through algorithms. Nevertheless, there are three kinds of data set., they are Dimensionality, Sparsity and Resolution.
In case of dimensionality, according to the number of the components the dimensionality will be high or it will be low. The sparsity is a scattered attribute and is not set in an orderly manner and have value ranging from 1% to even 0. In case of the resolution attributes are judged according to the resolution, they can be seen or they can be hidden with the resolution type. In the specific data worked on in this report specifies the Readmit historical as tracking record of the patient history, medical dependency, time of hospital discharge and the nurse allocated to the particular patient. It will take into consideration as a sparse data which have developed to make medium dimensional set, and the attribute of the information are unsynchronized.
Readmit Historical can be considered to be an "Record Data", and is traditional form of data keeping as it has no direct relation with the data attributes, and have interconnection between the data. For example, the date of birth or the information about the medical history of the patient cannot be related to the data of nurse allocated in the hospital but they will get linked if the patient gets admitted to the hospital. The record data also have variations, which can be implemented in analyzing the data set. They are as follows:
Transactional data: the transactional data are considered to be market based data, as they intend to keep every bit of attributes and data intact. The most dominance in the usage of this kind of data are in the departmental store as they are used to keep products, price and the customer credential, so that they can be extracted in the later part when the customer again visits stores (Baesens&Scheule, (2016)).
Data Matrix: The data having a constant numerical expression is considered to be matrix related data. The usage of this kind of data is done in many actuaries who find statistical data to represent some information.
Sparse data matrix: this kind of data has similar attributes and data, which are represented in data sheet in an unsynchronized way.
|
Data Name
|
Type of data
|
Length
|
Class
|
Description
|
|
Readmit_Historical
|
Sparse type of data
|
The number of elements are divided by total elements which can be represented as M*N
|
Colum format
Csr_matrix
|
There are data which have elements like time of admission and then it has element related to medical history which is not related to each other but can be built in the same type of data set
|
Table 1: The description of Dataset Readmit_historical
Importance of Data set
It can be very valuable for the hospital and the care provider organization to keep track of the records of the patientgettingadmitted in the hospital, this can be later extracted out to keep relevancy with their medical history, is the same person gets admitted in the hospital. The type of treatment needed in the represented by thedataset will help in improving thefacilities from before, and cater to the demands of the patients.
This will eventually also help the U.S department to keep track of the treatmentfacilities that must be improvise by the use of various machine learning languages and will also help in utilizing tem in keeping the records necessary for future referral. The constant user of Data Analytics will prove the use of BI Tools, in giving competitive advantage to the organization. In this way, many hospitals and organizations have improved in giving adequate clinical solutions to thepatients and eradication of many diseases developing the overall development of the health and standard of living.
The fields in which the Data Analytics can be developed and the organization are dependent on the Data Analytics are defined below:
Educational implementation: In the University of Alabama it has been noticed that it has helped more than 40000 students to keep track of the records, or their educational assignments as well as grades and performance through the use of data analytical tools, there are huge data in the education system, as every year new students are enrolled. Therefore, to keep track of the records. The data management is necessary (Chatterjee &Chowdhury, (2016)). Nevertheless, data analytics have improved the customization of educational patterns, changing the syllabus and constant updating of the records, the classes are also arranged in the form of implementing new technologic al advances which is supported by Data Analytics. There are many onshore and offshorestudents which can learn through the process of data analytical in accessing the student portal through the college websites, which can be also supported by the Data Analytics.
Business organizations:the use of Data Analyticsis also utilized in maintaining the business records, the mainrecord keeping is used in the R&D department for the further utilizing of the data. This helps in keeping their annual records, performances, revenue collection, stakeholder's division etc. In keeping the recordsintact, the use of BI tool has been taken into consideration by many organizations. This eventually helps in keeping their confidentiality.
Health care systems: the record keeping has been dominant in the field of health and social care organizations. As there are huge records related to the patients and their treatments which needs to be managed. The use of wearable devices and attachments of sensors in the patient body has helped the development of the health and social care departments. The example of Apple can be the most appropriate in this case as they have invented many such devices like Apple Health Kit, and Research Kit.
DO WANT TO HIRE TUTOR FOR ORIGINAL BIG DATA AND ANALYTICS ASSIGNMENT SOLUTION? AVAIL QUALITY BIG DATA AND ANALYTICS ASSIGNMENT WRITING SERVICE AT BEST RATES!
Task 2 For your project, perform the relevant data analysis tasks by answering the guided questions provided and, identify the visualization you need to develop.
Solution:
Reporting dashboard
1. Create a data dictionary for the data source by the group.
|
DATA NAME
|
DESCRIPTION OD DATA
|
TYPE OF DATA
|
SIZE OF DATA
|
|
Patient_id
|
High dimensional data
|
Auto-number
|
12
|
|
Nurse_id
|
Assigned care taker of patient
|
Long Integer
|
10
|
|
Str_patient_first_name
|
First name
|
numeric
|
17
|
|
Str_last_name
|
Last name
|
numeric
|
9
|
|
Str_house_no
|
House number
|
Long Integer
|
25
|
|
Str_street
|
Street
|
Long Integer
|
14
|
|
Str_locality
|
Locality
|
Long Integer
|
18
|
|
Str_country
|
Town
|
Text
|
10
|
|
Str_town
|
Country
|
Text
|
10
|
|
Str_post_code
|
Post Code
|
Text
|
10
|
Taking the main source of data this is the classification of data dictionary which can be categorized to the data of hospital and its care users and providers as well.
2. What are the average number of ICU days with respect to diagnose group and gender?
It is generally three to four days, the female proposition is much more in the admission of hospital
3. For each region, what is most and least common diagnosis group?
The least common disease is the heath attack in women, elephantitis which has been nearly become extinct.
Most common disease is the ADHD, anxiety due to obesity or stress.
4. For each diagnosis group, which is most and least popular disease?
The CHF (chronic heart failure) can lead to inclusion of Diabetes, anxiety, and stress.
The least common disease can be the Walking Corpse Syndrome
5. What are top 5 departments with respect to number of patients?
• ADHD
• Depression and anxiety
• Cancer
• Insomnia
• Diabetes
6. What are top 3 regions with respect to female patient numbers?
• Japan
• China
• Estonia
7. What are top 5 places where patients are discharged?
There is a presence of Law Discharge Act, the patients can be discharges if they feel healthy and cannot be forced to stay in the hospital, as the health organizations often for it to increase their billing charges. The countries which follow the rules are as follows:
• United Kingdom
• United States of America
• NHS
• Australia
• Mayo clinic
8. What are top 3 regions with respect to "black" race?
The Detroit, Michigan ca n be considered as the topmost place with 713777 population of back race and a mixed race of African American. Later in the second and third position comes the Jackson, Mississippi, Miami gardens, Florida with black race count of 173514 and 107167.
9. What are the top 5 hospitals with respect to Asthma patients' number of visits?
• Apollo hospital
• Mayo Clinic
• Cystic fibrosis center at women & children's hospital
• Cystic fibrosis Center
• UCLA medical center
10. What are the active and inactive months in terms of admission for both male and female patients?
It generally takes one or two months
ARE YOU LOOKING FOR RELIABLE BIG DATA AND ANALYTICS ASSIGNMENT HELP SERVICES? EXPERTSMINDS.COM IS RIGHT CHOICE AS YOUR STUDY PARTNER!
11. What are top 3 regions with respect to average days spend in hospital? Hint- You need to create a measure to calculate number of days spend in hospital
To calculate the average treatments, there is an availability of formula. They are calculating the average daily census. And the formula can be represented as follows:
In house census+ daily census/ number of days spent in a month
To calculate the normal treatment of patient in the duration of two to three days
12. What are top 10 cities with respect to number of patients?
• Sioux falls
• Tulsa
• England
• Washington, dc
• Miami
• Billings
• Charleston
• Boston
• Honolulu
• Manchester
13. What is the trend of number of patient's admission from October 2011 to June with respect to region for both male and female?
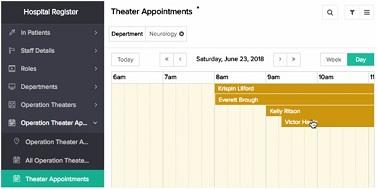
The use of BI tool can be represented, for filtering the patient list. It can be modified by the use of organizer in the BI tool. The menu bar in the BI tool can be needed to choose the property.
The filtering procedure helps in narrowing down the records and data in a fecund manner. The choices and the date filled values can be the easiest filters to record and showdata's.
14. Display only the most and least popular month in question 9 at a time.
It has been recorded that near- about 29 patients has been admitted in hospitals and within the month of January to February.
15. What is the trend of patient numbers between Jan 2012 to June 2012 diagnosed with "CHF" only?
More than 57 patients are admitted in case of "CHF" and the time span of January to June.
DO YOU WANT TO EXCEL IN BIG DATA AND ANALYTICS ASSIGNMENT? HIRE TRUSTED TUTORS FROM EXPERTSMINDS AND ACHIEVE SUCCESS!
16. What is the trend of different diagnose group over the months?
In case of CHF there are more than 300 admissions in every hospital, and the increment in the diseases are most prone in the women by the percentage of 56% and 47.2% in male.
17. What are top 5 departments in terms of number of operations and how these operations vary across months?
• Fractures
• Enteric
• Central nervous system breakdown
• Pulmonary diseases
• Heart diseases
18. What are the most appropriate predictors of heart disease? Hint- use decision tree
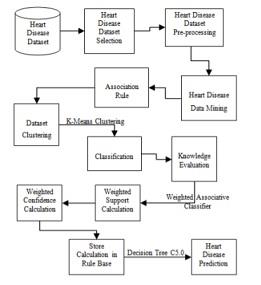
The presented decision tree will be helpful in understanding the heart diseases. This decision tree has been done by the use of pruning technique, which helps in reduction of fitting data and makes fast classification related to data and this prevents irrelevant prediction due to data.
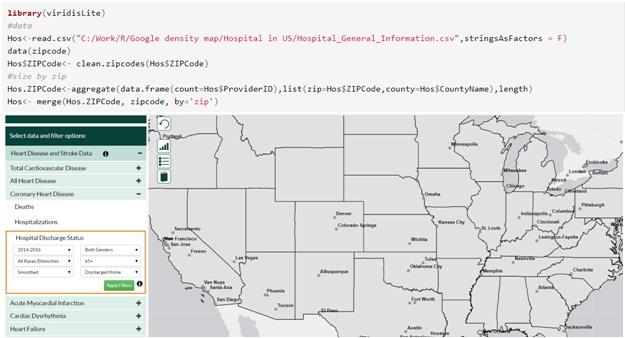
19. Create a geomap of the Hospitals and patient number.
The code of the geomap has been given below which can represent the hospital keeping records of the patient number and their medical records as well.
20. Create a cluster analysis on patient related data.
The use of the command PROC ACELUS will be utilized in the usage of the heart diseases. The cluster analysis has been given below:
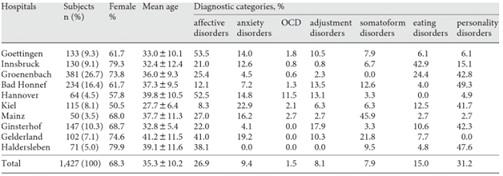
The cluster analysis will help in analyzing the mean age of female suffering from heart diseases. The categories are also given where the probability of disorders are most dominant in the particular state.
MOST RELIABLE AND TRUSTWORTHY BIG DATA AND ANALYTICS ASSIGNMENT HELP & HOMEWORK WRITING SERVICES AT YOUR DOORSTEPS!
Task 3 In addition to the guided questions, it is expected that each student will provide at least two other visualizations of the data.
Solution:
21. Additional visualization for representing data of medical records
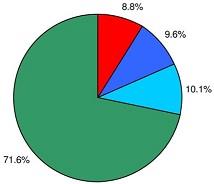
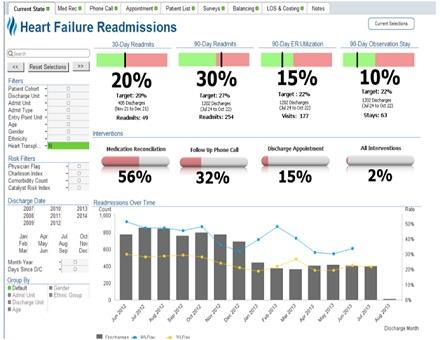
In this chart it has been represented about the patient admission number in one period of time, this has been done by the use of Data Analytical tool and patient number along with the range in the population has been given. With 8.8% of high admission in older people getting admission to hospital due to heart diseases, and 9.6% to 10.1% in middle ages to young people.
22. State the most frequent type of disease in the recent years
|
Diseases
|
1 month
|
1 year
|
2 years
|
3 years
|
4 years
|
|
Cancer
|
85%
|
90%
|
80%
|
65%
|
70%
|
|
Diabetes
|
85%
|
40%
|
30%
|
40%
|
30%
|
|
Procedures required probability
|
|
|
|
|
|
|
Cancer
|
60%
|
50%
|
60%
|
70%
|
60%
|
|
Diabetes
|
60%
|
20%
|
40%
|
40%
|
45%
|
Table1 : representation of disease data
23. How will BI tool will help in keeping hospital records?
24. name top 5 hospitals to treat heat diseases?
• Cleveland Clinic
• Mayo Clinic
• Cedars- Sinai Medical Center
• Massachusetts General Hospital
• Mount Sinai hospital
Task 4 Justify why these visualizations are chosen in Task 2 and 3.
Solution:
Justification
The most dominant tool for representing data are the one that is used in SAS Visual Analytics, they are the Business tool, which can be implemented in drawing scatterplots and line graphs. The above visualization is the line graph. It is used as it helps in comparison of two types of data. In another case the use of Geomaps have been used in representing the variables of thee hospital keeping records.
Business tool therefore can be said to be the most useful tool in keeping records as there are many other tools that are implemented in keeping records safe that is OLAP, Android BI, which is mostly used in android phones, Cloud Analytics BI is also used in keeping huge data.
ORDER NEW BIG DATA AND ANALYTICS ASSIGNMENT AT NOMINAL PRICE!
Task 5 Discuss the findings from the data set. In this discussion you should explain what each visualization shows. Then summarize the main findings.
Solution:
Discussion of Findings
The dataset has been checked to utilize the various implementation in the real world. The dataset has been sorted from the Teradata university portal. The various use of SAS analytics has been used in keeping records and the use of BI tool has been represented. The data set that been taken into consideration from the SAS analytical tool. It has described its data type in a tabular form, further analysis has been done in regards to keeping records in BI Tool and creating visualization to represent a certain data type clearly. The motive of the report is to clarify the use of data set, SAS analytics is to make the U.S department understand and improving the overall development of the health services in hospitals.
Conclusion
The report has made many utilization of tools and helped in representing structures of SAS Visual Analytics in representing the data of the medical departments. The use of Big Data Analytics in developing the health and social care departments have made huge difference and therefore the main motive of the report, is to make the report clarify the use of data analytics in making changes in the health standard of the American people.
ENDLESS SUPPORT IN BIG DATA AND ANALYTICS ASSIGNMENTS WRITING SERVICES - YOU GET REVISED OR MODIFIED WORK TILL YOU ARE SATISFIED WITH OUR BIG DATA AND ANALYTICS ASSIGNMENT HELP SERVICES!
Avail our assignment help service for below mention course:-
- ITECH2001 Game development fundamentals assignment help
- ITECH1104 Cloud and enterprise computing assignment help
- ITECH2000 Mobile development fundamentals assignment help
- ITECH3002 Professionalism and entrepreneurship assignment help
- ITECH2002 Systems modeling assignment help
- ITECH3001 User experience assignment help
- ITECH2003 Web design assignment help
- ITECH3208 Project assignment help
- ITECH2004 Data modeling assignment help
- ITECH3215 Information security assignment help