ARE YOU LOOKING FOR RELIABLE STATISTICAL ANALYSIS PROJECT ASSIGNMENT HELP SERVICES? EXPERTSMINDS.COM IS RIGHT CHOICE AS YOUR STUDY PARTNER!
MAT10251 - Statistical Analysis Project Assignment - Southern Cross University, Australia
Part A - Preliminary Analysis of Sample Data
a) Price of two and three year old cars
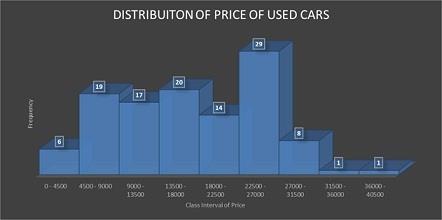
1. Construct a frequency histogram or polygon for the price of two and three year old cars.
2. Calculate descriptive statistics for the price of two and three year old cars.
b) Difference in price between cars for sale privately and those for sale by a used car dealer.
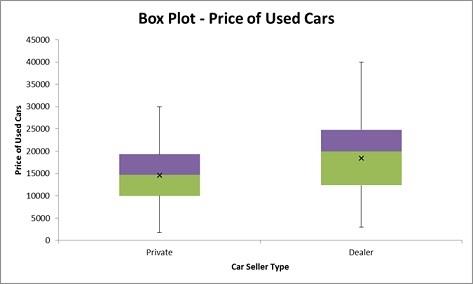
1. Construct separate boxplots, on the same plot or separately, for private sale prices and for used car dealer prices.
2. Calculate descriptive statistics for private sale prices and for used car dealer prices.
c) Relationship between price and age and between price and odometer reading
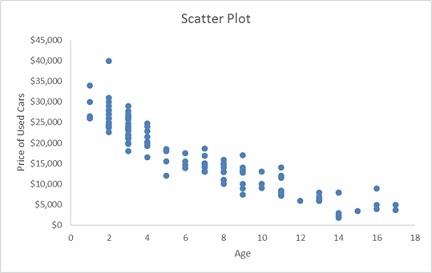
1. Construct scatter plots for Age and Price and for Odometer and Price.
2. Calculate the correlation coefficient for Age and Price and for Odometer and Price.
Solutions -
Sample Number is 5
Histogram of used Cars
|
Class Interval
|
Frequency
|
|
0 - 4500
|
6
|
|
4500 - 9000
|
19
|
|
9000 - 13500
|
17
|
|
13500 - 18000
|
20
|
|
18000 - 22500
|
14
|
|
22500 - 27000
|
29
|
|
27000 - 31500
|
8
|
|
31500 - 36000
|
1
|
|
36000 - 40500
|
1
|
|
Total
|
115
|
SAVE YOUR HIGHER GRADE WITH ACQUIRING STATISTICAL ANALYSIS PROJECT ASSIGNMENT HELP & QUALITY HOMEWORK WRITING SERVICES OF EXPERTSMINDS.COM!
Descriptive Statistics
|
Price
|
|
|
|
Mean
|
17236.57
|
|
Standard Error
|
759.5753
|
|
Median
|
16900
|
|
Mode
|
23990
|
|
Standard Deviation
|
8145.537
|
|
Sample Variance
|
66349781
|
|
Kurtosis
|
-0.75397
|
|
Skewness
|
0.069603
|
|
Range
|
38190
|
|
Minimum
|
1800
|
|
Maximum
|
39990
|
|
Sum
|
1982205
|
|
Count
|
115
|
Difference in Price of Used Cars
|
|
Private
|
Dealer
|
|
Mean
|
14611
|
18466.95775
|
|
Standard Error
|
1104.141723
|
1005.02106
|
|
Median
|
14750
|
19996
|
|
Mode
|
15500
|
23990
|
|
Standard Deviation
|
7069.956626
|
8468.45798
|
|
Sample Variance
|
49984286.7
|
71714780.56
|
|
Kurtosis
|
-0.499191626
|
-0.829589315
|
|
Skewness
|
0.165449913
|
-0.0353172
|
|
Range
|
28190
|
36991
|
|
Maximum
|
29990
|
39990
|
|
Minimum
|
1800
|
2999
|
|
Sum
|
599051
|
1311154
|
|
Count
|
41
|
71
|
|
Geometric Mean
|
12460.80605
|
16060.83378
|
|
Harmonic Mean
|
9603.135707
|
13185.61178
|
|
AAD
|
5641.560976
|
7406.494743
|
|
MAD
|
4750
|
6006
|
|
IQR
|
9310
|
12445
|
DO YOU WANT TO EXCEL IN STATISTICAL ANALYSIS PROJECT ASSIGNMENT? HIRE TRUSTED TUTORS FROM EXPERTSMINDS AND ACHIEVE SUCCESS!
Relationship between price and age
Correlation Coefficient Table
|
|
Age
|
Price
|
|
Age
|
1
|
|
|
Price
|
-0.9194
|
1
|
Question - Written Answer - Preliminary Analysis - Introduce your data and the results of your preliminary investigation of the price of used cars, of the make and model in the state specified by your sample.
Preliminary Analysis
The main objective of this study is to determine the factors that influence the price of the used cars in Australia. In the recent years, the sale of used cars has been increased drastically and there are many reasons behind it. One of the major reason is that the seller decided to buy a new car while the buyer likes to gain experience in car driving. If the buyer is new to his driving skills, there is more chance of his car being hit and get damaged. Thus, he is more interested in buying used cars which is nearly 60% less than the new car of the same make and so, he can gain experience in his driving with minimal cost involved.
For the purpose of this study, a random sample of 115 cars were taken from Queensland State and the car type of Nissan X-Trail sales details was used for the analysis. Regarding the price of used cars, it is seen that about 25.2% of the used cars price ranges between $ 22500 and $ 27000, 17.4% of the used cars price ranges between $ 13500 and $ 18000 and 16.5% of the used cars price ranges between $ 4500 and $ 9000
On an average, the price of used Nissan X Trial cars is $ 17236.56 with a standard deviation of $ 837.54. The median price of used Nissan X Trial cars is $ 16900 and the recorded minimum and maximum price of used Nissan X Trial cars is $ 1800 and $ 39990 respectively.
Regarding the customer intention of buying white cars, it is seen that about 45.22% of the customers prefer white cars while 54.78% of the customers prefer non-white cars
On an average, the price of used Nissan X Trial cars sold privately is $ 14611 with a standard deviation of $ 7069.96. The median price of used Nissan X Trial cars sold privately is $ 14750 and the recorded minimum and maximum price of used Nissan X Trial cars is $ 1800 and $ 29990 respectively. On an average, the price of used Nissan X Trial cars sold through dealer is $ 18466.96 with a standard deviation of $ 8468.46. The median price of used Nissan X Trial cars sold through dealer is $ 19996 and the recorded minimum and maximum price of used Nissan X Trial cars is $ 2999 and $ 39990 respectively. Thus, the dealer sold used cars are sold at high price when compared with cars sold privately
Regarding the relationship between age and price of used cars, it is seen that the relationship is very strong and negative (correlation coefficient = - 0.9194, p - value = 0.000 < 0.05). This indicates that as the age of the car increases, then there is a significant drop in the price of the cars
Thus, we can say that the price of the used car depends on its age and also the seller (either private or dealer) who involved in selling the car.
EXPERTSMINDS.COM ACCEPTS INSTANT AND SHORT DEADLINES ORDER FOR STATISTICAL ANALYSIS PROJECT ASSIGNMENT - ORDER TODAY FOR EXCELLENCE!
Part B - Preparation
Task 1 - Appendices Statistical Inference and Regression and Correlation
Question 1 - Estimate the population mean price of two and three year old used cars of the make and model for sale in the state specified by your sample.
The descriptive statistics for the price of cars
The table given below shows the information about the price of used cars in the sample and the price of used cars sold between 2016 and 2017
|
Price
|
Price (2016 - 17)
|
|
Mean
|
17236.57
|
25111.08
|
|
Standard Error
|
759.5753
|
604.4957
|
|
Median
|
16900
|
24500
|
|
Mode
|
23990
|
23990
|
|
Standard Deviation
|
8145.537
|
3775.074
|
|
Sample Variance
|
66349781
|
14251186
|
|
Kurtosis
|
-0.75397
|
5.310218
|
|
Skewness
|
0.069603
|
1.49746
|
|
Range
|
38190
|
22000
|
|
Minimum
|
1800
|
17990
|
|
Maximum
|
39990
|
39990
|
|
Sum
|
1982205
|
979332
|
|
Count
|
115
|
39
|
Here, we see that the price of used cars of the entire sample is 17236.57 ± 8145.54 and the price of used cars sold between 2016 and 2017 is 25111.08 ± 3775.07. Thus, we see that the price of used cars sold between 2016 and 2017 is high when compared with the overall sample
Null Hypothesis: H0: µ = 17236.57
The average price of used cars sold between 2016 and 2017 do not differ significantly from $ 17236.57
Alternate Hypothesis: Ha: µ ≠ 17236.57
The average price of used cars sold between 2016 and 2017 differ significantly from $ 17236.57
Level of Significance:
Let the level of significance be α = 0.05
Test Statistic
The t test statistic is
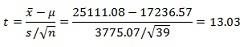
The p - value of t test statistic is 0.000. Since this p - value <0.05, we reject the null hypothesis at 5% level. Therefore, there is enough statistical evidence to conclude that average price of used cars sold between 2016 and 2017 differ significantly from the overall sample price of used cars.
NEVER LOSE YOUR CHANCE TO EXCEL IN STATISTICAL ANALYSIS PROJECT ASSIGNMENT - HIRE BEST QUALITY TUTOR FOR ASSIGNMENT HELP!
Question 2 - Are more than 30% of used cars of the make and model for sale in the state specified by your sample white?
The frequency distribution of White car is given below
|
White
|
Frequency
|
Percentage
|
|
No
|
63
|
54.78%
|
|
Yes
|
52
|
45.22%
|
|
Total
|
115
|
|
Null Hypothesis: H0: P <= 0.3
That is, proportion of white car purchases is not greater than 30%
Alternate Hypothesis: Ha: P > 0.3
That is, proportion of white car purchases is greater than 30%
Level of Significance:
Let the level of significance be α = 0.05
Test Statistic
The z test statistic
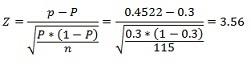
The p - value of z test statistic is 0.0002.
Since the p - value of z test statistic is less than 0.05, there is sufficient evidence to reject the null hypothesis at 5% level of significance. Thus, there is sufficient evidence to conclude that the proportion white car sales is greater than 30%.
ORDER NEW STATISTICAL ANALYSIS PROJECT ASSIGNMENT & GET 100% ORIGINAL SOLUTION AND QUALITY WRITTEN CONTENTS IN WELL FORMATS AND PROPER REFERENCING.
Question 3 - Is there a difference in the average price of cars, of the specified make and model for sale in the specified state, for sale privately and by a used car dealer?
Null Hypothesis: H0: µ1 = µ2
That is, the average price of cars do not differ significantly between private and dealer sale
Alternate Hypothesis: Ha: µ1 ≠ µ2
That is, the average price of cars differ significantly between private and dealer sale
Level of Significance:
Let the level of significance be α = 0.05
Test Statistic
The table given below shows the workings of t test statistic
t-Test: Two-Sample Assuming Equal Variances
|
|
Price - Private
|
Price - Dealer
|
|
Mean
|
15251.15909
|
18466.95775
|
|
Variance
|
52625931.86
|
71714780.56
|
|
Observations
|
44
|
71
|
|
Pooled Variance
|
64450882.38
|
|
|
Hypothesized Mean Difference
|
0
|
|
|
df
|
113
|
|
|
t Stat
|
-2.087762093
|
|
|
P(T<=t) one-tail
|
0.019533353
|
|
|
t Critical one-tail
|
1.658450216
|
|
|
P(T<=t) two-tail
|
0.039066706
|
|
|
t Critical two-tail
|
1.981180359
|
|
The mean price of used cars sold privately is 15251.16 ± 7254.37 and the mean price of used cars sold through dealer is 18466.96 ± 8468.46. On comparing the mean values, we see that the mean price of used cars sold through dealer is significantly high when compared with the cars sold privately (t test statistic = - 2.088, p - value = 0.039 < 0.05)
GET GUARANTEED SATISFACTION OR MONEY BACK UNDER STATISTICAL ANALYSIS PROJECT ASSIGNMENT HELP SERVICES OF EXPERTSMINDS.COM - ORDER TODAY NEW COPY OF THIS ASSIGNMENT!
Question 4 - Simple Linear Regression Model - Calculating the least squares regression line, correlation coefficient and coefficient of determination.
Interpreting the gradient and vertical intercept of the simple linear regression equation.
Interpreting the correlation coefficient and coefficient of determination. Are these values consistent with your scatter plot?
Dependent Variable: Price
Independent Variable: Age
The regression output is given below
|
SUMMARY OUTPUT
|
|
|
|
Regression Statistics
|
|
Multiple R
|
0.88
|
|
R Square
|
0.78
|
|
Adjusted R Square
|
0.77
|
|
Standard Error
|
3316.00
|
|
Observations
|
115.00
|
|
ANOVA
|
|
|
df
|
SS
|
MS
|
F
|
Significance F
|
|
|
Regression
|
1.00
|
4307212746.58
|
4307212746.58
|
391.71
|
0.00
|
|
|
Residual
|
113.00
|
1242534410.41
|
10995879.74
|
|
|
|
|
Total
|
114.00
|
5549747156.99
|
|
|
|
|
|
|
|
|
|
|
|
|
|
Coefficients
|
Standard Error
|
t Stat
|
P-value
|
Lower 95%
|
Upper 95%
|
|
Intercept
|
25292.72
|
554.91
|
45.58
|
0.00
|
24193.34
|
26392.11
|
|
Age
|
-1390.91
|
70.28
|
-19.79
|
0.00
|
-1530.14
|
-1251.68
|
The regression equation is
Price = 25292.72 - 1390.91 * Age
Coefficient of Determination = 0.78
Dependent variable variation explained from the model = 78%
Unexplained variation = 22%
Here, we see that the model is good fit in predicting the price of used cars using Age as independent variable. Regarding the relationship between age and price of used cars, it is seen that the relationship is very strong and negative (correlation coefficient = - 0.9194, p - value = 0.000 < 0.05). This indicates that as the age of the car increases, then there is a significant drop in the price of the cars.
DO WANT TO HIRE TUTOR FOR ORIGINAL STATISTICAL ANALYSIS PROJECT ASSIGNMENT SOLUTION? AVAIL QUALITY STATISTICAL ANALYSIS PROJECT ASSIGNMENT WRITING SERVICE AT BEST RATES!
Question 5 - Multiple Linear Regression Model - Calculating the multiple regression equation, multiple correlation coefficient, and coefficient of multiple determination.
Interpreting the values of the multiple regression coefficients.
Interpreting the values of the multiple correlation coefficient and coefficient of multiple determination. Compare these values with the corresponding values for the simple linear regression model.
Dependent Variable: Price
Independent Variable: Age, Odometer (kms) and Transmission
The multiple regression output is given below
|
SUMMARY OUTPUT
|
|
Regression Statistics
|
|
Multiple R
|
0.882
|
|
R Square
|
0.778
|
|
Adjusted R Square
|
0.772
|
|
Standard Error
|
3333.440
|
|
Observations
|
115.000
|
|
ANOVA
|
|
|
df
|
SS
|
MS
|
F
|
Significance F
|
|
|
Regression
|
3.000
|
4316335014.541
|
1438778338.180
|
129.482
|
0.000
|
|
|
Residual
|
111.000
|
1233412142.451
|
11111821.103
|
|
|
|
|
Total
|
114.000
|
5549747156.991
|
|
|
|
|
|
|
|
|
|
|
|
|
|
Coefficients
|
Standard Error
|
t Stat
|
P-value
|
Lower 95%
|
Upper 95%
|
|
Intercept
|
24702.362
|
858.535
|
28.773
|
0.000
|
23001.117
|
26403.608
|
|
Age
|
-1362.512
|
141.809
|
-9.608
|
0.000
|
-1643.517
|
-1081.507
|
|
Odometer (kms)
|
0.000
|
0.008
|
-0.009
|
0.993
|
-0.015
|
0.015
|
|
Transmission
|
639.346
|
705.687
|
0.906
|
0.367
|
-759.019
|
2037.712
|
The regression equation is
Price = 24702.36 - 1362.51 * Age - 0.0001 * Odometer + 639.35 * Transmission
The coefficient of determination is 0.778, indicating that 77.8% of the variation in price is explained by the regression model and the remaining 22.2% left unexplained.
GETTING STUCK WITH SIMILAR STATISTICAL ANALYSIS PROJECT ASSIGNMENT? ENROL WITH EXPERTSMINDS'S STATISTICAL ANALYSIS PROJECT ASSIGNMENT HELP SERVICES AND GET DISTRESSED WITH YOUR ASSIGNMENT WORRIES!
On comparing the simple linear regression and multiple linear regression models, we see that there is no much difference in the coefficient of determination between these two models. Thus, we can conclude that the simple linear regression model is the best as it explains more variation of price with single independent variable when compared to that of multiple linear regression models.
The t test for significance of slope was used to test whether the independent variable is a significant predictor of dependent variable price. From the above regression output, we see that
1. Age is a significant predictor of price of used cars (t test statistic = - 9.61, p - value < 0.05).
2. Odometer is insignificant predictor of price of used cars (t test statistic = -0.009, p - value 0.993 > 0.05).
3. Transmission - Automatic is insignificant predictor of price of used cars (t test statistic = 0.906, p - value 0.367 > 0.05).
NEVER BE CAUGHT IN PLAGIARISM, AVAIL STATISTICAL ANALYSIS PROJECT ASSIGNMENT HELP SERVICE OF EXPERTSMINDS.COM AND SAVE HIGHER MARKS!
Get our best Southern Cross University, Australia Assignment Help Services for related units and courses such as:-
- MAT71215 Introductory Algebra and Calculus Assignment Help
- MAT10706 Quantitative Methods with Economics Assignment Help
- MAT83001 Analysis of Multivariate Behavioural Data Assignment Help
- MAT10721 Multivariate Calculus and Differential Equations Assignment Help
- MAT10722 Complex Analysis Assignment Help
- MAT71004 Introduction to Evidence for Health Science Practitioners Assignment Help
- MAT82001 Applied Research and Evaluation Methods for Health Sciences Assignment Help
- MAT83002 Applied Research and Evaluation for the Psychological Scientist-Practitioner Assignment Help