ARE YOU LOOKING FOR RELIABLE RANDOM SAMPLING TECHNIQUE ASSIGNMENT HELP SERVICES? EXPERTSMINDS.COM IS RIGHT CHOICE AS YOUR STUDY PARTNER!
Assignment - You just have to write the method how can calculate it.
# Interpret the result of the test of null hypothesis
# H0: "mean of population of x is less than 0.4"
# using these data and t.test():
set.seed (22)
x <-runif(15)
t.test(x,mu=0.4,altemative = 'greater')
# Output
# One Sample t-test
# data: x
# t = 3.9187, df = 14, p-value = 0.0007719
# alternative hypothesis: true mean is greater than 0.4
# 95 percent confidence interval:
# 0.5228421 Inf
# sample estimates:
# mean of x
# 0.6231297
Answer - Test Results
Here, we wish to determine whether the mean of X is greater than 0.4 and therefore, we perform one sample z test to test the claim and the direction of the test is one tailed test - right tailed test
The mean of x is 0.623. Here, we see that the mean of x for a sample of 15 is 0.623 with a standard deviation of 0.181. On comparing the mean values, we see that the mean of x for a sample of 15 is greater than the hypothesized value of 0.4.
SAVE YOUR HIGHER GRADE WITH ACQUIRING RANDOM SAMPLING TECHNIQUE ASSIGNMENT HELP & QUALITY HOMEWORK WRITING SERVICES OF EXPERTSMINDS.COM!
The sample information is given below
Sample Size = n = 15
Sample mean = x bar = 0.623
Sample standard deviation = s = 0.181
Population mean = µ = 0.4
Samples for this data can be selected using simple random sampling procedure. Simple random sampling is always high rated than the quota sampling technique due to its probability method used to collect the sample respondents. Samples selected using quota sampling will have high chance of biased results and hence simple random sampling is the best methods of selecting a representative sample from a population
Simple random sampling technique, is a probability sampling technique, in which, all samples have equal chance of being selected. For example, drawing a card numbered 10 from a pack of 52 cards, throwing a die and face turns up to 6, tossing a coin and getting head uses the simple random sampling techniques. This sampling technique is one of the best and easy sampling techniques and it is preferred by most researchers. This sampling technique is simple and do not involve any complex technique to select the samples from the desired population
Null Hypothesis: H0: µ < = 0.4
That is, the mean of x is not greater than 0.4
Alternate Hypothesis: Ha: µ > 0.4 (Right tailed test)
That is, the mean of x is greater than 0.4
Level of Significance
Let the level of significance be α = 0.05
Rejection Region
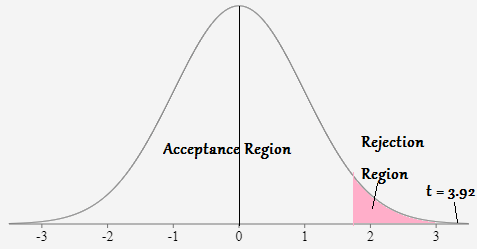
If the p - value of t test statistic is greater than 0.05, then, we do not reject the null hypothesis at 5% level of significance.
If the p - value of t test statistic is less than 0.05, then, we reject the null hypothesis at 5% level of significance.
DO YOU WANT TO EXCEL IN RANDOM SAMPLING TECHNIQUE ASSIGNMENT? HIRE TRUSTED TUTORS FROM EXPERTSMINDS AND ACHIEVE SUCCESS!
Test Statistic
The t test statistic is calculated by using the formula given below
t=(x- -μ)/(s⁄√n)=3.9187
Here, the value of t test statistic is 3.9187 and its corresponding p - value is 0.00077.
Since the p - value of t test statistic is less than 0.05, there is enough statistical evidence to reject the null hypothesis at 5% level of significance. Therefore, we can conclude that the mean of x is greater than 0.4 and statistically significant.
The 95% confidence interval for the mean of x is (0.5228, ∞). This indicates that when the samples are repeatedly taken from the same population, the, we can say that 95 out of 100 times the true mean population of x will fall within this interval.
The mean of x is 0.623. Here, we see that the mean of x for a sample of 15 is 0.623 with a standard deviation of 0.181. On comparing the mean values, we see that the mean of x for a sample of 15 is greater than the hypothesized value of 0.4.
Here, we see that the hypothesized value of 0.4 do not fall in this confidence interval and the lower limit of this confidence interval is greater than the hypothesized value of 0.4. Therefore, we can conclude that the mean of x is greater than 0.4 and statistically significant.
EXPERTSMINDS.COM ACCEPTS INSTANT AND SHORT DEADLINES ORDER FOR RANDOM SAMPLING TECHNIQUE ASSIGNMENT - ORDER TODAY FOR EXCELLENCE!