SAVE DISTINCTION MARKS IN EACH MPE781 ECONOMICS FOR MANAGERS ASSIGNMENT WHICH IS WRITTEN BY OUR PROFESSIONAL WRITER!
MPE781 Economics for Managers - Deakin University
Learning Outcome 1: Interpret and apply basic principles and their effect on individual economic decisions (microeconomics), the economy as a whole (macroeconomics) and how economic indicators (data) are used to validate these economic behaviours.
Learning Outcome 2: Apply economic principles to the analysis of important decisions confronting the management of business organisations.
Learning Outcome 3: Critically evaluate existing economic theories in the context of real and contemporary national and international circumstances.
NO PLAGIARISM POLICY - ORDER NEW MPE781 ECONOMICS FOR MANAGERS ASSIGNMENT & GET WELL WRITTEN SOLUTIONS DOCUMENTS WITH FREE TURNTIN REPORT!
Question 1: In your own words, summarize the article, "Road Congestion in Australia" In particular, what are the main messages of the article?
Solution Q1
Road Congestion in Australia
HoustonKemp, an economic consulting firm, prepared the road performance parameters. The data was delivered by HERE Technologies and Here collected data from in-vehicle navigation systems of cars and hand-held smartphones to deliver speed-related statistics across Australia. The information was collected for a road link, and this report holds the highest value for intra-city comparisons. The performance matrices which this report measured arepercentage of free flow (POFF), free-flow speeds,percentage of speed limit (POSL), variability & average speed.
Key Findings: The key findings of this report shows the worsening road performance of Australia. The average speed and free-flow speed declined most in Melbourne, 8.1 and 12.3 percent respectively. The free flow overnight speed is lowest for Adelaide. As per POSL, the lowest scored city is Melbourne, and as per POFF, the most congested city is Sydney. In terms of predictability and variability, again, Melbourne receives the most variable results, closely followed by Sydney (Bradley, 2018).
City by City Analysis:
Sydney-
Average Speed: For 2013-2015, the average speed of Sydney remained static, and later it dropped by over 2km/h to 58.2 km/h in 2018. Average AM peak speed was 55.7 km/h, and PM peak speed was 55km/h in 2018.
Variability: Average variability for Sydney increased steadily.
Congestion: As per POFF, the measurement for congestion increased in 2015, later it decreased steadily, dropping to 92.5 % in 2018. The POSL data also showed a declination from 2015-2018.
Melbourne-
Average Speed: From 2013-2015, it was unchanged. Since 2016, it started decreasing and average speed percentage fallen to 8.1%, making it the worst deterioration among all capitals. Average peak speed (AM/PM peak) was also parallel to average speed.
Variability: Variability for Melbourne increased steadily, and in 2018 it registered the worst variability results concerning all other cities.
Congestion: As per the POSL metric, Melbourne holds the credit of most congested city and second most congested capital according to the POFF metric.
Brisbane:
Average Speed: Until 2016, it was steady, and after that, it started to decline by a total of 3.7% between 2013-2018.
Variability: Variability declined gradually for Brisbane.
Congestion: As per POFF, speeds enhanced from 2014 to 2017, but in 2018, it started to decline.
Canberra:
Average Speed: Average speed decreased by 1% within 2013-2018, making it the third-fastest capital under this parameter. PM peak performance is better than AM peak performance.
Variability: Variability decreased over time, but in 2018, it started to increase.
Congestion: As per POFF, speeds declined since 2016. POSL data remained static until 2016, later it showed declination.
Adelaide:
Average Speed: Average speed declined by a total of 2.5% from 2013-2018. AM/PM peak speeds also decreased since 2015.
Variability: Variability decreased from 2013-2016, but increased in 2017.
Congestion: As per POFF, speeds declined until 2017, and improvement found in 2018. POSL remained unchanged till 2016, later declined significantly.
Perth:
Average Speed: It improved in 2016, but deteriorated since then. The average speed of Perth is 61.7 km/h. AM/PM peak speed was also quite similar.
Variability: Reliability, opposite to variability, increased from 2013 to 2016, but later declined gradually.
Congestion: As per POFF, speeds improved, which means congestion also improved. As per POSL, speed increased in 2016 but then declined significantly.
Hobart:
Average Speed: Average speed decreased in 2015, increased in 2016 and 2017, again deteriorated in 2018. AM/PM speed also showed similar drift.
Variability: Reliability improved over time, but slightly decreased in 2018.
Congestion: POFF speeds increased for the first three years, and decreased in 2018. POSL speeds also increased gradually until 2017 and decreased in 2018.
Darwin:
Average Speed: Average speed increased gradually. AM/PM peak speed also improved with time.
Variability: Reliability improved with time, though it declined slightly in 2018.
Congestion: POFF speeds improved for the first three years, later reduced in 2018. POSL speeds declined for first three years, improved in 2016 and 2017, later decreased again in 2018.
Airport Routes:
Average Speed: Capital city carport speeds declined by 6.1% since 2013, except Perth.
Variability: Most variable airport routes was the road between Tullamarine Airport and Melbourne CBD. The most reliable route was between Canberra airport and Civic.
Congestion: As POFF, the most congested route was Brisbane CBD Airport.
Conclusion: The road congestion report gives us in-depth knowledge about the current road scenario of Australia, and indicates that there are so many actions that need to take immediately to improve the situation.
ENROL WITH MPE781 ECONOMICS FOR MANAGERS ASSIGNMENT HELP AND HOMEWORK WRITING SERVICES OF EXPERTSMINDS.COM AND GET BETTER RESULTS IN MPE781 ECONOMICS FOR MANAGERS ASSIGNMENTS!
Question 2:
Solution Q2
(a) What is the market price of road space in a competitive equilibrium?
a) The relationship between road space and price can be represented with the help of the following diagram.
In the diagram, the demand curve is downward sloping curve as the price of the road rises, the demand for corresponding road space declines. This is due to the combined effect of substitution and income effects. It is represented by DD curve. The supply curve is vertically sloped as indicated by SS curve. This is simple logic as logic the overall supply of road space is constant and it is independent of the price of the road space. The competitive equilibrium is shown as the intersection of the two curves. The competitive market equilibrium is thus obtained at point E. P* thus shows the market price.
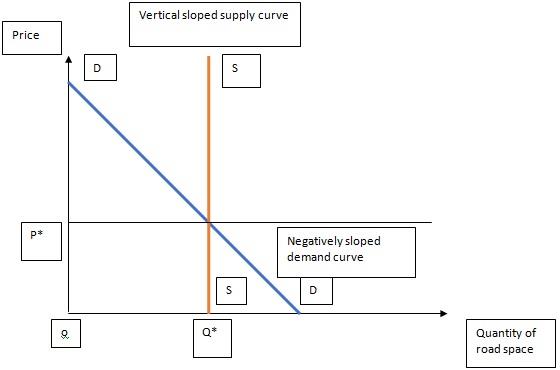
Figure 1: Competitive market price of road space
(b) Suppose that road space is a public good, which is freely available to individuals. How much is the excess demand for road space?
This section focuses on road space as a public good. Public goods can be defined as good, which possesses two distinct characteristics. The first feature is non-excludability and the second feature is non-rivalrous consumption nature. The concept of nonexcludability states that it is not possible for the policymaker to exclude a non-payer from enjoying the free services offered by the public good. For instance, if a fired worker displays a fireworks show in a fair, people can have a glance at the display without paying any sum of money. The producer of the firework display cannot compel anyone to pay a charge for experiencing the fireworks display. It is, therefore, a very good example of a free-rider problem (Wu et al. 2017).
This is a very common problem which is persistent with public goods. Everyone has an incentive to free-ride a certain public good by actually not paying anything for good. It thus creates a negative externality in the case of public goods.
The second important aspect of the public good is non-rivalrous consumption feature. It means that nonpayers can enjoy the benefit of the public good without diminishing the opportunity of other people from consuming the same public good. For instance, an entrepreneur decides to exclude nonpayers from enjoying the benefits of the show. A price has been attached to enter the show or consuming the concerned public good. The aim is to exclude the non-payers. However, in the case of public good such approach does not work (Litman, 2017).
A situation known as market failure arises in this situation. It can be defined as a situation where there is an inefficient distribution of goods and services. Furthermore, the individual incentives which are produced as a result of rational behaviour do not lead to rational outcomes for the group as a whole. Thus there arises a significant excess demand for road space in the mentioned scenario. It is a typical example of market failure in case of public goods (Brown et al. 2018).
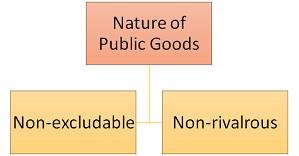
Figure 2: Characteristics of the public good
(c) Suppose we measure congestion by the amount of excess demand for road space. Can a rise in fuel taxes and car taxes reduce congestion?
c) Reduced congestion in car tax
When there is inefficiency in the allocation of public goods and services, the situation of market failure arises. Therefore, the optimal production of the public good becomes difficult. The intuition is quite clear as efficient allocation becomes a problem because the price mechanism cannot guide the market to produce optimum quantity of goods and services (Zheng and Geroliminis, 2016). Whenever this kind of situation arises, the market fails to produce the optimum supply of public goods. Hence, as seen in the above case, the overall supply of road space is undersupplied, or in other words, there is excess demand in case of road space. It thus becomes necessary for the regulatory authority to correctly gauge the reasons persistent behind such market failures and take necessary steps. The government should take required forms of intervention to correct market failure.
One of the most efficient tools of the government to tackle the problem of market failure is through taxation. The imposition of taxes on certain goods can internalize external costs and helps to discourage the use of the concerned good. The case can be analyzed with the help of the mentioned case in the question. The government has decided to increase fuel taxes and car taxes to combat the situation. It can be visualized as an effective step to overcome the situation of the market failure which is caused by congestion. Some people will try to reduce their fuel expenditure by reducing their fuel consumption and using public transport. Hence the problem of congestion can be addressed efficiently.
(d) Can building more roads reduce congestion? Would your conclusions change if, with more roads, individuals were encouraged to drive more?
d) Reduced congestion for building more roads
The next question analyses the impacts of increasing road space. This implies the supply curve of public good (road space) shifts rightward. However if more drivers are encouraged to drive more, the overall impact of the policy could be ambiguous. The first case can be where the total number of drivers is relatively less than the available space. The result would be a fall in the amount of excess need for road space. The Second Case could Be the reverse of the earlier case. This means that the total number of drivers has exceeded the total available space. Here the situation of excess demand aggravates. The last case could be where the two values exactly offset each other. There would be no change in this case.
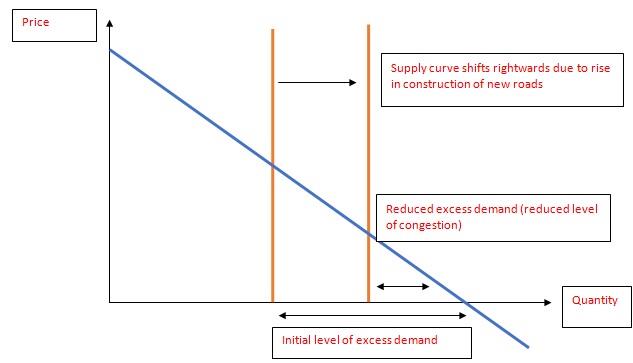
Figure 3: Effect of building more roads upon level of congestion
MOST RELIABLE AND TRUSTWORTHY MPE781 ECONOMICS FOR MANAGERS ASSIGNMENT HELP & HOMEWORK WRITING SERVICES AT YOUR DOORSTEPS!
Question 3:
Do you think a road-pricing system by charging the use of road space is a good policy to reduce traffic congestion in Australia? Why or why not? Use appropriate diagrams to support your answer.
Solution Q3
Road pricing strategy in Australia
Road pricing is the direct charges that are imposed for the utilisation of roads involving road tools, congestion charges, as well as distance or time-based fees. As stated by Wang et al.(2015, p.10539), congestion pricing strategy has been identified as the most effective countermeasure to mitigate urban traffic congestion. In addition to that, congestion charges are also implemented to discourage the utilisation of certain types of vehicles, fuel sources as well as polluting vehicles. As highlighted by Liu et al. (2018, p.907), congestion has been identified as the major as well as costly issue in Melbourne, and the cost can enhance from $ 2.7 billion in the year 2001 to $8 billion in 2020.
Benefits of road pricing strategy
The basic aim of the road pricing strategy is to make the road congestion-free which can lead to fewer traffic jams. In the following context, the motorist in the major cities of Australia is spending more 27 minutes on road which is costing the business $8.20 per vehicle per day. On a similar note, Sydney is experiencing worst congestion in terms of extending the travel time by 39% which is approximately equal to 156 extra travel years per hour (news.com.au, 2019). On a wider note, Liu et al. (2018, p.911), suggested that due to rapid enhancement in the population as well as car possessions in the megacities, traffic congestion has become a significant hindrance for further enhancement of mobility and transport sustainability. In the concerned case, implementation of potential road tax can also lead to fewer traffic jams in the cities.
Along with that, it can also reduce travel hours in terms of conveying more effective work. Birot (2018) highlighted that Global Commuter Pain Survey depicted that approximately 48% of the drivers admitted that the respective nation is becoming worse and 15% of the drivers demonstrated that congestion is hell on the road. Therefore, enforcement of the potential road pricing strategy in the concerned nation can facilitate in conveying positive effects in the economy as people will spend less time in traffic jams and more in working. As suggested by Ison (2016, p.81), it can also help socially in terms of employing g people for monitoring as well as controlling the road pricing strategy.
Another aspect is that Ndevr Environmental which is the emission tracking organisation depicted that the annual emission of greenhouse gases up to December 2018 has enhanced to 558.4 million tons in Australia. This particular report also depicted that; it was the highest record of carbon emission in Australia (theguardian.com, 2019). In the following context, the implementation of proper road pricing strategy in terms of addressing the equity concern and technical factor can facilitate in reducing the carbon emission. In addition to that, it can also facilitate the nation in conveying healthier air and less wastage of petrol.
Limitations of road pricing strategy
One of the most significant limitations of the road pricing strategy is that it can be quite expensive to the administrator for gathering the congestion charge, which is higher than the petrol tax. In the following context, potential road pricing strategy needs to be the revenue-neutral as well as satisfy the treasury. On the other hand, Kaddoura et al. (2015, p.207) mentioned that transport sector congestion leads to welfare losses as well as inefficient market balance. However, without the proper acceptance from the nations individual's enforcement of the potential pricing strategy cannot be done. This can also convey an unfair feeling because something that we're free will now is charged. Therefore, individuals of Australia will be unable to connect properly with the extra charges that will be implemented for reducing the congestion on the road. Apart from that, the road pricing strategy can also reduce the sales especially for the shops which are in the middle.
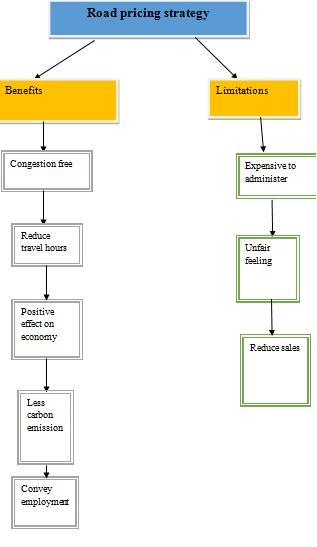
Figure 1: Impact of road pricing strategy
Conclusion
Thus it can be concluded that road pricing strategy facilitates in reducing congestion as well as environmental degradation. In addition to that, this is quite an effective measure to mitigate traffic congestion. Along with that, it facilitates in reducing the travel hours which can lead to conveying effective work. But there are some limitations in implementing the road pricing strategy such as the unfair feeling as well as the acceptance issue among the individuals.
WE HELP STUDENTS TO IMPROVE THEIR GRADES! AVAIL TOP QUALITY MPE781 ECONOMICS FOR MANAGERS ASSIGNMENT HELP AND HOMEWORK WRITING SERVICES AT CHEAPER RATE!
Question 4:
Find two other cities that are among the most congested cities in the world. Give a brief description about the congestion-easing policies in these cities.
Solution Q4
Traffic Congestion is an automatic situation on the road networks occur as the use of the vehicle rises, and it is being categorized by the slower speeds, lengthier tip times plus an increase in the queue of the vehicles. The traffic flow demand is very much high when the speed of the vehicle reduces and the hustle of the traffic steam out. The traffic congestion occurs when the demand approaches out the capability of the road and when the vehicle entirely stops in the road, it is known as the traffic jam. The traffic jam can lead to car driver becoming irritated plus engaging in road rage.
Moscow in Russia and Istanbul in Turkey I find are the two most congested cities in the world. Both the cities have recorded the highest number of traffic congestion in the cities.
In Moscow drivers on average waited out for 210 hours with a standard speed of 18 kilometres per hour. The traffic jams in Moscow are horrible because the city of Moscow is a radial ring planning centre which was most typical for any Russian cities. The drivers also used to park out cars in small lanes, and the drivers didn't like to abide by the rules which created out many accidents and the accidents contributed out to traffic jam especially in the wintertime. (Times, 2019)
The precautions taken by the government of Russia regarding traffic congestion have been remarkable, which now have reduced traffic congestion very much. The Russian government have been improved the pavement for walking, making the roadway more full and also raising them further above the road. The government have also implemented Intelligent Transport System which led to the easing of the congestion and near about 2000 surveillance cameras, 3700 road detectors and 6000 traffic lights which have played an essential role of emergency responding and also law enforcement. The government have also introduced paid parking areas and also increased out new pedestrian areas for less congestion. The government has also introduced metro services, which is very helpful to reduce out the traffic congestion which prevails in the country. (Totton, 2018)
Istanbul,Turkey is the second most congested cities in the world. It has emerged out as the second most congested city in the world. The drivers here wait for an average of 157 hours in peak time. The traffic jams in Istanbul Turkey was also very worst because there have been no proper maintenance on roads and the traffic system are worst, and the drivers of Istanbul don't tend to follow any rules of the traffic rules. Though the government is increasing the number of roads, still the problem continues, and the public transport mode is not up to the mark in Istanbul Turkey. (Bianet - Bagimsiz Iletisim Agi, 2019) (Köse, 2015)
Some precautions have been taken by the administration to reduce the traffic congestion in Istanbul Turkey through the implementation of the infrastructure project by the administration and smart transport system by the municipality of Istanbul. Though these are some steps taken by the government to reduce the congestion. But there are some other necessary steps which the government should imply such as the increase of public transport such as metro rails which would reduce the congestion. There should be paid to park and also the walking pavement for the people for a walk. It could ultimately reduce congestion at a significant level. (AKYÜZ, 2015) (Hürriyet Daily News, 2019)
The best suggestion or strategy to reduce road congestion in Australia is to introduce road prices in Australia, which would help to increase the road revenue, and smart technology should be implemented. Following the example of London there could be congestion charge on the drivers of Australia and also the government could implement out new technologies such as smart transport system encouraging the people to use share transport and also paid parking is also a great way to implement road congestion where the drivers won't be able to park their cars in any lanes. Encouraging people to use public transport would be another great way to reduce traffic congestion. (Wen et al., 2019) (Basford and Williams, 2019) (Waterford, 2019)
Increase in the roads doesn't stop traffic congestion because the demand for the car is increasing. So to prevent traffic congestion, the government of the country should imply out these necessary steps to reduce traffic congestion.
NEVER BE CAUGHT IN PLAGIARISM, AVAIL MPE781 ECONOMICS FOR MANAGERS ASSIGNMENT HELP SERVICE OF EXPERTSMINDS.COM AND SAVE HIGHER MARKS!
Get our Deakin University Assignment Help services for below mentioned courses like:-
- MPM731 Business Communication for Managers Assignment Help
- MWL717 Entrepreneurship Experience Assignment Help
- MAA767 Integrated Reporting and Value Creation Assignment Help
- MPF753 Finance Assignment Help
- MAA763 Governance and Fraud Assignment Help
- MPK704 Sustainable Environmental Marketing Assignment Help
- MMH733 Ethics for Managers Assignment Help
- MPM732 Critical Thinking for Managers Assignment Help
- MPM755 Building Success in Commerce Assignment Help