WORK TOGETHER WITH EXPERTSMIND'S TUTOR TO ACHIEVE SUCCESS IN ITECH7407 BUSINESS ANALYTICS PROJECT ASSIGNMENT!
ITECH7407 Real Time Analytic - Federation University
Business Analytics Project
This is a business analytics project aimed at generating innovative analytics solutions for a Company. The objective is to analyze the given datasets from a relevant firm's perspective in terms of implications and strategies which the chosen company could adopt to improve its functions, resources and processes efficiently and effectively.
EXPERTSMINDS.COM ACCEPTS INSTANT AND SHORT DEADLINES ORDER FOR ITECH7407 BUSINESS ANALYTICS PROJECT ASSIGNMENT - ORDER TODAY FOR EXCELLENCE!
Task 1 Write a description of the selected dataset and project, and its importance for your chosen company. Information must be appropriately referenced.
solution
Here we have taken the data set from Kaggle by name UNITED NATION EXPORT data. The dimensions of the data set are like 10000 records / observations and 6 variables / features and the features are like Country or Area, Commodity - Transaction, Year, Unit, Quantity, Quantity Footnotes, as we are allowed to select the data set on our own but we should select the data set relate to Environmental issues like climate change, energy consumption, carbon footprint, greenhouse gas emission, pollution dashboard, etc. So, we have selected the UNITED NATION EXPORT data where it is about the municipal waste which is also related to the environmental issue as if the municipal waste is not collected or treated properly it will be a problem for environment.
ARE YOU LOOKING FOR RELIABLE ITECH7407 BUSINESS ANALYTICS PROJECT ASSIGNMENT HELP SERVICES? EXPERTSMINDS.COM IS RIGHT CHOICE AS YOUR STUDY PARTNER!
Task 2 - Perform Data Mining on data view
Upload the selected dataset on SAP Predictive Analysis. For your dataset, perform the relevant data analysis tasks on data uploaded using data mining techniques such as classification/association/time series/clustering and identify the BI reporting solution and/or dashboards you need to develop for the operational manager of the chosen company.
solution:
We have used SAP analytics for creating the predictive modelling and the data visualization here we have created a Classification / regression model using auto modeler command in the SAP then we select the option Classification / Regression model which leads us to importing the data set to the SAP, once the data is imported then we go the next window there we click on analyse and the SAP environment automatically finds the required variables and removes the insignificant variables and it also helps us to find the target variable as it only decides by itself and lets us know and here we can even give the required confidence interval as there is no confidence interval given so we are going with 95 % confidence interval and now we will run the model and get the results. The results are shown in below figures.
Overview
|
Model: Unit_UNdata_Export_20190531_065846731
|
|
Data Set:
|
|
UNdata_Export_20190531_065846731.csv
|
|
Initial Number of Variables:
|
|
7
|
|
Number of Selected Variables:
|
|
5
|
|
Number of Records:
|
|
10,000
|
|
Building Date:
|
|
2019-09-26 14:06:41
|
|
Learning Time:
|
|
1 s
|
|
Engine Name:
|
|
Kxen.RobustRegression
|
|
Author:
|
|
|
Table 1 illustrates the overview of the predictive modelling
Nominal Targets
|
Unit
|
|
Target Key
|
|
Terajoules
|
|
KxMissing - Frequency
|
|
0.05%
|
|
Terajoules - Frequency
|
|
99.95%
|
Table 2 illustrates the Nominal of the predictive modelling
Performance Indicators
Target: Unit
|
rr_Unit
|
|
Predictive Power (KI)
|
|
0.0000
|
|
Prediction Confidence (KR)
|
|
1.0000
|
Table 3 illustrates the Performance Indicators of the predictive modelling
The above tables represent the overview, nominal Targets, Performance Indicators.
In table1 overview we see that data set name UNdata_Export_20190531_065846731.csv, Initial Number of Variables which are of 7, Number of selected variables they are 5, no. of records as 7440, and learning time required for the model is 1s, next we table 2 have Nominal targets which has Target key Terajoules, KxMissing in frequency that is 0.05 %, and it also has Terajoules in frequency that is 95.5 % and next table 3 is performance indicators, which has predictive power (KI) and he prediction confidence (KR) they are 0 and 1.0000 respectively.
|
Variable
|
Value
|
Storage
|
Missing Value Count
|
Missing Value Weight
|
Role
|
|
Country or Area
|
nominal
|
string
|
0
|
0
|
input
|
|
Commodity - Transaction
|
nominal
|
string
|
0
|
0
|
input
|
|
Year
|
continuous
|
integer
|
3
|
3
|
input
|
|
Unit
|
nominal
|
string
|
3
|
3
|
target
|
|
Quantity
|
continuous
|
number
|
3
|
3
|
input
|
|
Quantity Footnotes
|
nominal
|
integer
|
3
|
3
|
input
|
|
KxIndex
|
continuous
|
integer
|
|
|
skip
|
Table 4 illustrates the statistical summary of the predictive modelling
In table 4 Model statistical reports are as follows variable, value, storage, Missing Value Count, Missing Value Role Weight, which helps us to see what kind of data do we have or we have used in the model. By these we can get to know country or area variable is a nominal value type of data is string , commodity - Transaction variable is a nominal value type of data is string, year variable is a Continuous value type of data is integer , country or area variable is a nominal value type of data is string , Quantity variable is a Continuous value type of data is number , Quality Footnotes variable is a nominal value type of data is integer , KxIndex variable is a Continuous value type of data is integer.
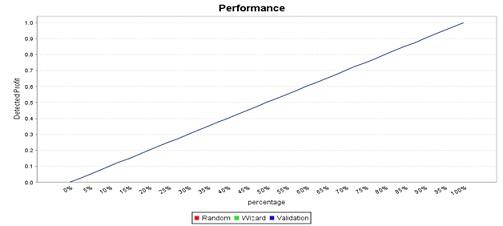
Fig 1 illustrates the linear graph obtained from the created model.
In the above graph we can observe that quantity is going in a linear graph through validation line graph.

Fig 1 illustrates the linear graph obtained from the created model.
In the above figure we have plotted the bar graph sensitivity versus Specificity, we can observe as the specificity is increasing the sensitivity is also increasing which is represented by random and Wizard.
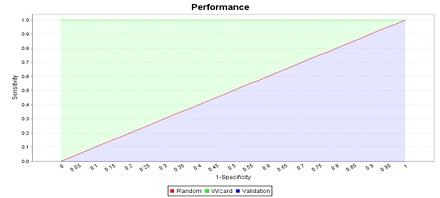
Fig 2 illustrates the ROC graph obtained from the Predicted model.
The above graph represents the ROC curve ( Receiver Operating Characteristics Curve ) here also we can see that sensitivity is directly proportional to 1 - specificity.
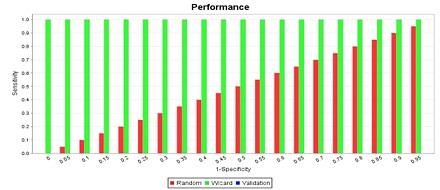
Fig 3 illustrates the ROC graph obtained from the Predicted model.
DO YOU WANT TO EXCEL IN ITECH7407 BUSINESS ANALYTICS PROJECT ASSIGNMENT? HIRE TRUSTED TUTORS FROM EXPERTSMINDS AND ACHIEVE SUCCESS!
Task 3 - Research
Justify why you chose those BI reporting solution/dashboards/data mining technique in Task 3 and why those data sets attributes are present and laid out in the fashion you proposed (feel free to include all other relevant justifications).
solution: Now we have done the cluster analysis using SAP analytics on data set of UNITED NATION EXPORT data. The dimensions of the data set are like 10000 records / observations and 6 variables / features and the features are like Country or Area, Commodity - Transaction, Year, Unit, Quantity, Quantity Footnotes here also we used the auto modeller option in it we went with create a clustering model then it was directed to file import section for cluster analysis as we selected the file and the it navigated to data description were we get option to write our own description or to let the system to analyse the data and let know us which are important variables and which are not and it even helps in sorting all the features in alphabetical order so in case if system has left any insignificant variable or it might have taken a significant variable as an insignificant we can just edit over here and then if we run the model we get the output as below.
Overview
|
Model: _UNdata_Export_20190531_065846731
|
|
Data Set:
|
|
UNdata_Export_20190531_065846731.csv
|
|
Initial Number of Variables:
|
|
7
|
|
Number of Selected Variables:
|
|
6
|
|
Number of Records:
|
|
10,000
|
|
Building Date:
|
|
2019-09-26 13:05:08
|
|
Learning Time:
|
|
5 s
|
|
Engine Name:
|
|
Kxen.SmartSegmenter
|
|
Minimum Requested Number of Clusters:
|
|
10
|
|
Maximum Requested Number of Clusters:
|
|
10
|
|
Percentage of Unassigned Records:
|
|
0.58%
|
|
SQL Expressions:
|
|
enabled
|
|
|
|
|
Table 5 represents the overview of the cluster analysis
Table 5 represents the over view of the cluster analysis here we can get to know the used data set name for building cluster model, Initial Number of Variables as 7, no . of selected variables as 6 , its 7440 number of records, it has taken 5 s to learn the model maximum no. of cluster formed are 10, minimum no. of clusters formed are 10 there is 0.58% of unassigned records and we have even enabled the SQL Expression.
Cluster Counts
|
clusterId
|
|
Initial Number of Clusters
|
|
10
|
|
Final Number of Clusters
|
|
10
|
|
Overlap
|
|
25.03%
|
|
Percentage of Unassigned Records
|
|
0.58%
|
Table 6 represents the Cluster Count of the cluster analysis
Table 6 represents the cluster count of the cluster analysis were we can find that initial number of clusters and the final number of cluster are 10 and there is anoverlap of 25.03 % and there is a 0.58 % of unassigned records.
|
Variable
|
Value
|
Storage
|
Missing Value Count
|
Missing Value Weight
|
Role
|
|
Country or Area
|
nominal
|
string
|
0
|
0
|
input
|
|
Commodity - Transaction
|
nominal
|
string
|
0
|
0
|
input
|
|
Year
|
continuous
|
integer
|
3
|
3
|
input
|
|
Unit
|
nominal
|
string
|
3
|
3
|
input
|
|
Quantity
|
continuous
|
number
|
3
|
3
|
input
|
|
Quantity Footnotes
|
nominal
|
integer
|
3
|
3
|
input
|
|
KxIndex
|
continuous
|
integer
|
|
|
skip
|
Table 7 represents the statistical summary of the cluster analysis
In table 7 cluster Model statistical reports are as follows variable, value, storage, Missing Value Count, Missing Value Role Weight, which helps us to see what kind of data do we have or we have used in the model. By these we can get to know country or area variable is a nominal value type of data is string , commodity - Transaction variable is a nominal value type of data is string, year variable is a Continuous value type of data is integer , country or area variable is a nominal value type of data is string , Quantity variable is a Continuous value type of data is number , Quality Footnotes variable is a nominal value type of data is integer , KxIndex variable is a Continuous value type of data is integer.
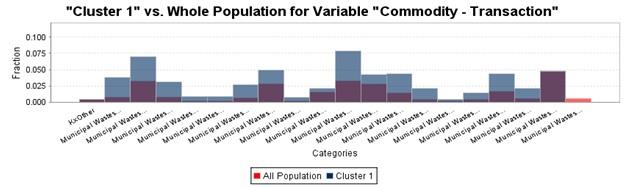
Fig 4 (a) illustrates the Cluster 1 versus Whole Population for Variable "commodity - Transaction".
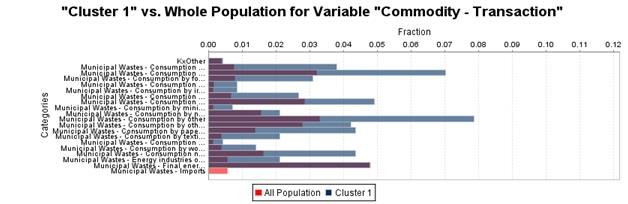
Fig 4 (b) illustrates the Cluster 1 versus Whole Population for Variable "commodity - Transaction".
In figure 4 (a), and 4 (b) we have illustrated the cluster 1 versus whole population for variable "commodity - Transaction" were we have taken categories for y - axis and Fraction for X - axis and we can observe that there is an over lap which has a KL significance of 1 and KL 0.773
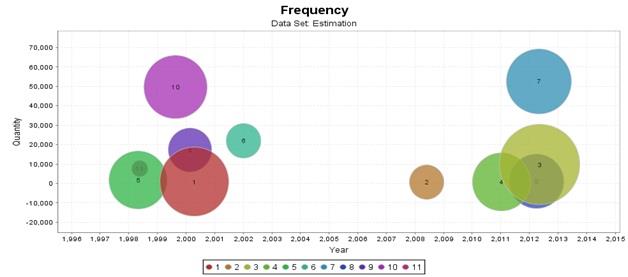
Figure 5 illustrates the 11 clusters from the clustering model
Fig 5 illustrates the 11 clusters from the clustering model we have plotted it quantity versus year and we can get few insights like which cluster has over lap, here we can observe that cluster 5 is completely overlapping cluster 11, there is a slight over lap of cluster 1 on cluster 5 and 9, cluster 10, 6, 7, 2 are free as they don't have any overlaps but in cluster 3, 4 and 6 there is a greater over lap cluster 3 has overlapped cluster 4 and 6 and even cluster 4 has aover lap on cluster 6.
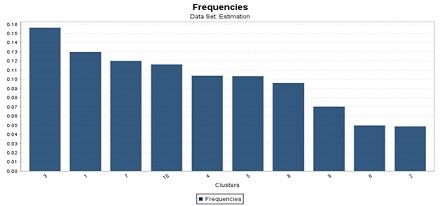
Figure 6 illustrates the frequencies of the clusters in the cluster model.
Here the fig 6 illustrates the frequencies of the clusters in the cluster model when the clusters are plotted against frequency we obtain the above plot as per the above plot we observe that cluster 3 has the highest frequency where the cluster 2 has the least frequency.
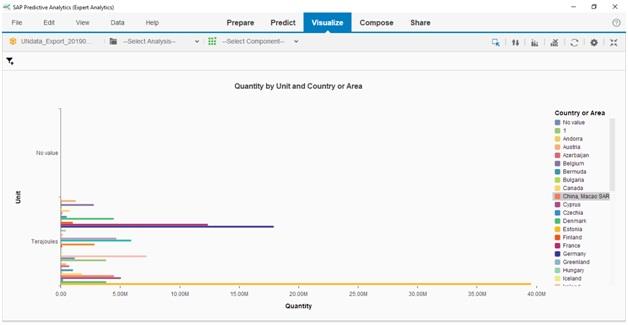
Figure 7 illustrates the plot of Quantity by Unit and country or area Bar graph
The above plot in fig 7 illustrates the plot of quantity versus unit and we find that country or area is completely found in terajoules here the highest quantity of the municipal waste is produced by United States of America which is denoted by purple bar it has the quantity of 39548804.00 of municipal waste and least quantity of the municipal waste is produced by Latvia it has 4310.00 of municipal waste.
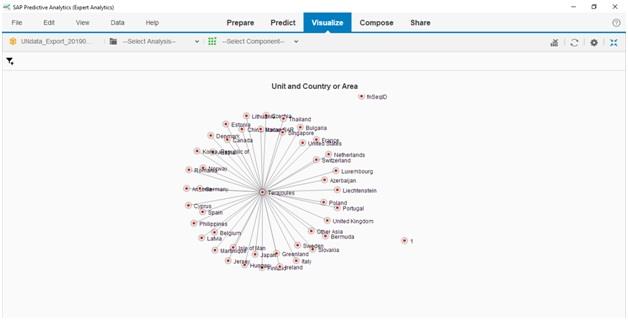
Figure 8 illustrates the plot of Unit and country or area Network graph
In fig 8 we observe the plot of unit and country of area network graph and we get to know that all the country or area is directly connected to Terajoules.
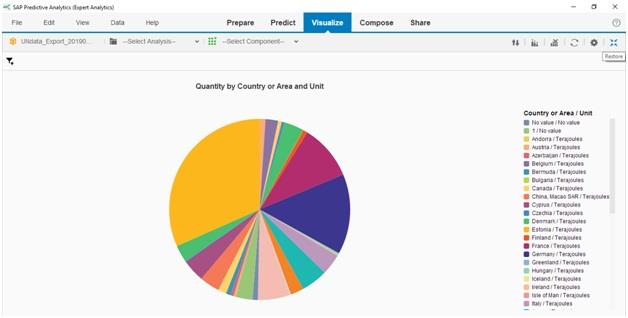
Figure 9 illustrates the plot of Quantity by Unit and country or area pie graph
SAVE YOUR HIGHER GRADE WITH ACQUIRING ITECH7407 BUSINESS ANALYTICS PROJECT ASSIGNMENT HELP & QUALITY HOMEWORK WRITING SERVICES OF EXPERTSMINDS.COM
In fig we can observe that united states of America has the highest municipal waste transaction and the 2nd highest country is Germany which produces 17901327.00 of municipal waste and the least is Latvia.
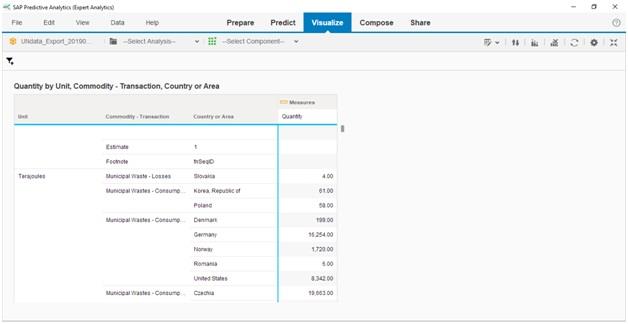
Figure 9 illustrates the plot of Quantity by Unit, Commodity - Transaction and country or area cross tab
In figure 9 we have plotted quality by unit, commodity - transaction and country or area in cross tab and got these insights in Terajoules as unit, commodity - transaction municipal waste - losses in Slovakia is 4.00, municipal waste consumption by agriculture, forestry and fishing in republic of Korea and Poland is 58.00 and municipal waste consumption by chemical and petrochemical in Norway, Denmark, Germany is 199.00, 16254.00, 1720.00 quantities respectfully.
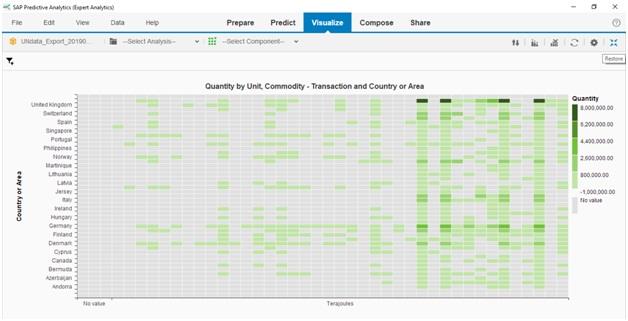
Figure 9 illustrates the plot of Quantity by Unit, Commodity - Transaction and country or area heat map
Here in fig 9 we can see the heat map plot of quantity by unit, commodity - transaction and country or area of consumption of municipal waste as the green color shade is getting darker it shows that there is a increase of consumption of municipal waste if color is too lite or near to white it means they are the least transaction makers the scale ranges from no value to 8000000.00 in between it is -100000.00, 800000.00, 2600000.00, 4400000.00, 6200000.00 and we can observe that in heat map dark green is towards the right side top end. Which is united states of America.
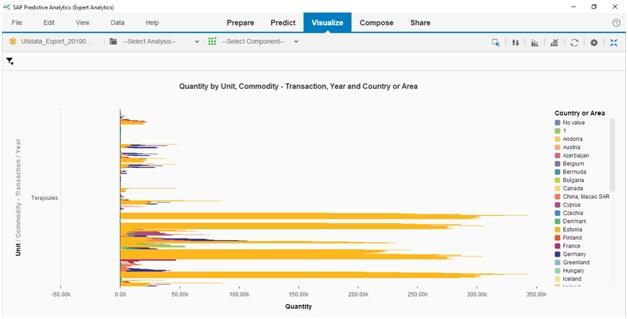
Figure 10 illustrates the plot of Quantity by Unit, Commodity - Transaction, Year and country or area bar chart
In the above figure 10 we have plotted quantity by unit, commodity - Transaction, Year and country or area in bar chart we can get insights like in which year how much quantity of the municipal waste is consumed by which country and number of units of it and also we can get the insights in which form the municipal waste is produced like it is from production or agriculture waste or is it generated from transformation or from generating electricity or from thermal plants or any other outputs of it can be visualized here. Orange color graph is denoting the municipal waste produced by united states of America, blue color bar indicates the municipal waste produced by Germany, and red color bar indicates the municipal waste produced from Sweden.
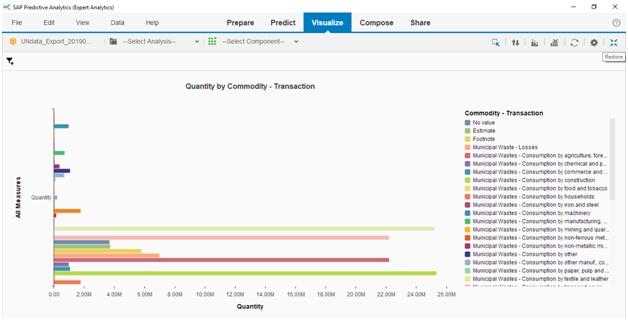
Figure 11 illustrates the plot of Quantity by Commodity - Transaction, bar chart
In the above figure we have plotted the quantity by commodity - transaction bar chart by plotting quantity versus all measures here we can measure the municipal waste consumption by which industry or which sector by how much like municipal wastes final consumption is 1760304.00, municipal waste by total energy is 25372417.00, municipal waste transformation in heat plants 1057247.00, municipal waste transformation in electricity, heat plants, C H P is 22196442.00, municipal waste transformation in electricity is 6974915.00, municipal waste transformation in C H P plant is 3720053.00, municipal waste transformation 22196442.00, municipal waste production is 25198772.00, municipal waste transformation by construction, manufacturing and non - fuel refiners is 699030.00 municipal waste from iron and steel plant is 12345.00, municipal waste by consumption of chemical and petrol wastes 2655431.00, municipal waste by consumption imports is 523.00, municipal waste by final consumption is 2341.00, municipal wastes consumption by wood and wood sector is 3241.00, municipal wastes by consumption by commerce and other industries 936555.00, and we can even know that maximum is consumed by municipal waste from total energy and the least municipal waste consumption is from consumption by transportation 752.36.
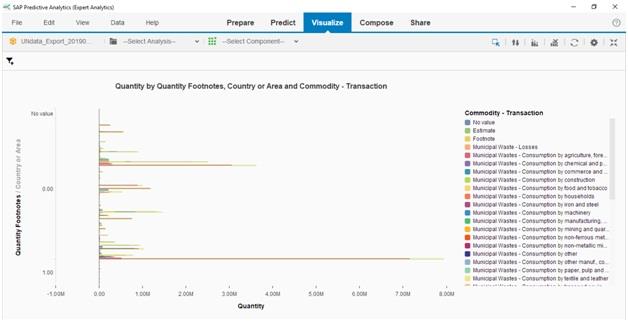
Figure 12 illustrates the plot of Quantity by Quantity Footnotes, Country or Area and Commodity - Transaction, bar chart.
As we can see the above figure 12, it shows that the waste material of transformation by countries or area and commodities. So from this graph we can observe that the maximum municipal waste production occurs in US is 79,49,426.00. The second highest for the waste material production in the world is Germany by this graph and the quantity of the waste material of Germany is 3,624,333.00. The third one is France which produce the waste material 2,510,700.00. The forth one is Netherlands which produced the municipal waste material 1,464,237. So these four countries are producing maximum municipal production of waste material in the world and there are many other country which is producing many more waste material as you can see in the given graph. From the given above graph we can observe that some countries are equivalently producing the municipal waste material like Belgium- 572,606.00 , Korea - 571,605.00, spain - 572,406.00, UK - 572,306.00, Denmark - 572,256.00 e t c. This graph also shows that some countries are producing very less municipal waste material like Bulgaria - 26400.00 , Cyprus - 45021.00 , Estonia - 1254.00 , Greenland - 5024.00.
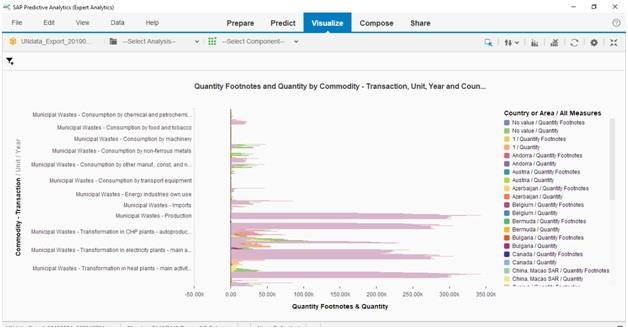
Figure 13 illustrates the plot of Quantity by Quantity Footnotes, Country or Area, unit, year and Commodity - Transaction, bar chart.
In the above figure 13 we observe that we have plotted quantity foot notes & Quantity versus Commodity - Transaction / unit / year in X - axis we have quantity foot notes and quantity we have a scale ranging from - 50.00 k to + 350.00 k it has a increment of 50 K in every unit, and in Y axis we have different kinds of municipal commodity transactions like municipal waste transactions - transformation in heat plant, municipal wastes - transformation in electric plants, municipal wastes - transformation in C H P plants, municipal wastes - production, municipal wastes - imports, Municipal wastes - energy industries own use, municipal wastes - consumption by the transport equipment, municipal wastes - consumption by other manufacturing, construction and non - fuel industries, municipal wastes - Consumption by non - ferrous materials, municipal waste - consumption by machinery, municipal wastes - consumption of food and tobacco, municipal wastes - consumption by commerce and public services, municipal wastes - consumption of chemical and Petro - chemical products. Here the pink bars indicate that maximum a municipal wastes commodity transaction is from United States of America, green bars indicate the municipal wastes commodity transaction is from Germany.
NEVER LOSE YOUR CHANCE TO EXCEL IN ITECH7407 BUSINESS ANALYTICS PROJECT ASSIGNMENT - HIRE BEST QUALITY TUTOR FOR ASSIGNMENT HELP!
Task 4 - Recommendations for CEO
The CEO of the chosen company would like to improve their operations. Based on your BI analysis and the insights gained from your "Dataset" in the lights of analysis performed in previous tasks, make some logical recommendations to the CEO, and justify why/how your proposal could assist in achieving operational/strategic objectives with the help of appropriate references from peer-reviewed sources.
solution:
Municipal waste material production produced due to the use of total energy supply, ferrous materials, by machinery, consumption by the transport equipment, consumption of food and tobacco, non - ferrous materials, consumption by commerce and public services, chemical and Petro - chemical products. Therefore, we can conclude that how much this energy effect our environment even thought this transformation of energy is obviously generated to human benefits but its effect the environment a very huge level. So, we need to be careful about this energy production or we may use another process from that our environment get free. Because if the environment gets polluted then there will be a chance of many disease arise which can occur and it will be the biggest problem of survival of human life. Therefore, it's our key responsibility to protect the environment. The above graph shows the develop country like United states of America, Germany, Sweden, Switzerland generating very large amount of municipal waste materials. So we suggest the C E O of the company to start the new projects which can utilize this waste in a use full form or we can try to overcome it by going for recycling or not trying to use it only, if we start a new method of it where we are not polluting the environment with the traditional process and if we start new process we will be the pioneers in it and it will help us to make great profits by being a ecofriendly human being.
ORDER NEW ITECH7407 BUSINESS ANALYTICS PROJECT ASSIGNMENT & GET 100% ORIGINAL SOLUTION AND QUALITY WRITTEN CONTENTS IN WELL FORMATS AND PROPER REFERENCING.
Below are the related courses in which we offer Assignment Help Service:
- ITECH1000 Programming 1 assignment help
- ITECH1001 Communications And Technology assignment help
- ITECH3001 User experience assignment help
- ITECH1006 Database Management Systems assignment help
- ITECH1004 Introduction to Multimedia assignment help
- ITECH2002 Systems modeling assignment help
- ITECH2100 Programming 2 assignment help
- ITECH1003 Network Protocols and Services assignment help
- ITECH2000 Mobile development fundamentals assignment help
- ITECH2114 Introduction to Mainframes assignment help
- ITECH1002 Network Operating Systems assignment help