ARE YOU LOOKING FOR RELIABLE ITECH7406 BUSINESS INTELLIGENCE AND DATA WAREHOUSING ASSIGNMENT HELP SERVICES? EXPERTSMINDS.COM IS RIGHT CHOICE AS YOUR STUDY PARTNER!
ITECH7406 Business Intelligence and Data Warehousing - Data Analysis Assignment, Federation University, Australia
Purpose: To encourage and provide students on-hands experiences of using SAP or Watson Analytics tools to explore, extract and analyse enterprise data.
This is a business analytics project aimed at generating innovative analytics solutions. It will allow students to show innovation and creativity in applying SAP Business Object/Predictive Analytics or Watson Analytics in designing useful visualization solutions and predictive models for different types of analytics problems.
The topic will be on environmental issues. Your main task is to apply any of the analytical tools to develop innovative analytics visualization solutions and predictive models with regards to environment.
ORDER NEW ITECH7406 DATA ANALYSIS ASSIGNMENT AT NOMINAL PRICE!
Solution 1:
Answer - ENVIRONMENT CLIMATE CHANGES
Background
In this paper we study and analysis data file regarding U.S. Pollution. We analysis the file that have contain major pollutants Nitrogen Dioxide, Sulphur Dioxide, Carbon Monoxide and Ozone in a CSV file. Our data set is from 2000 - 2016.In this file five pollutants included has its own five columns of metrics. There is a total of 28 fields. The four pollutants (NO2, O3, SO2 and O3) each has 5 specific columns. Observations totalled to over 1.4 million. In this paper we will discuss environment issue air pollutions and their impact on human.
Executive Summary
In this paper we are going to discuss about climate warming projection about to greenhouse gas emissions. According to our analysis the climate change will impact on world economy and human activity areas. In this paper we are going to make a discussion about global warming and climate change. Our discussion is about the climate changes . The past two decades our industries growing rapidly and they are disposing waste product. This may lead to pollution and gases emissions. This will impact on environment . The environment change impact .showing the climate change or global warming Global warming is a serious issue as that will impact on human health . The human life span is short due to global warming or climate change. In this paper we are discussing the about global warming . We are going to make review 10 article .These ten articles related to environment issue or climate changes. Afterwards , we are going to analysis the environment changes due to greenhouse gas emission using BI tool. in this paper we are going to analysis the current estimate of the impacts of climate change . This BI tool is easy to use and help for prediction. We are using this tool due to simple and GUI interface. We can show our information using BI tool is in form of charts. We can generate any type of graph just selecting the graph type.
Literature Survey
For intention of that study the review of literature with regard to Global Warming and Its Impact on Climate : For this we review article as given below
1) Mark Maslin (2004) has discuss about global warming.. According Mark Maslin in 21st facing the major is global warming due to environment degradation .In this article author discuss topics that is related to collision in climate change. The Author is giving solution on local solution and provide step for achieve goal. This article author focus on main anxiety to entirely costal area zones . This paper solution will help for reduction of coastal protection deluges and storms & raise The problem of global warming and climate change is increasing.
2) Alexander Gillespie (2006) - This book author discuss about the science and analysis: climate change, ozone depletion. Author discuss about the global warming, greenhouse gases increase CO2, air pollution causes environmental pollution. This book author discuss about the law that help for safe the environment.
GET BENEFITTED WITH QUALITY ITECH7406 DATA ANALYSIS ASSIGNMENT HELP SERVICE OF EXPERTSMINDS.COM
3) H.V.Jadhav, Dr.H.S Purohit (2007) - The author discuss environmental pollution has assumed global dimensions. According the author the due to Economic developments. The rapidly growth of economic brought alterations into weather conditions. According the author this is global warming depletion of resources. According to the author global warming is major issue in current scenario. According to the author this global warming is
as of Green House Gases effect, climate change & tsunamis.
4) Usha (2007) - The author of book is climate change. The author says , climate change is grave intimidation for human health etc. . According to the author climate change impact ecological, societal, financial pressure facing.. The author has elaborate about the global warming issue and impact.
5) Dr. Chintamani Rout (2014) - According to the author the major problem is today environment safeguard & development of human environment. According to the author we need to emphasis onsolve complexity of environment.
6) Dr.P.S.Kamble (2015) - The author is focus on hot topic or important environmental . Author discuss about evil impact of climate change. hence there is need to control it. The pollution has impact on environment such as atmosphere land, water, plants, and animal, organic along with the inorganic creatures.
7) Bhawana Upadhyaya and Bharat Upadhyaya (2016) The author is summarize, industry is rapidlly growing . The climate change due to various transportation, and deforestation raises much Sulpher dioxide (SO2) &Carbon dioxide (CO2) gases and that is a reason augment of global warming. This global warming impact reflect as of the heap to cavernous into oceans. In this paper author research using sampling .
8) Aramesh Shahbazi and Behnam Rezaei Nasab (2016) has discuss about the Manufacturing Rebellion era, gas external after burning fossil fuels along with widespread clearance of jungles ." This is anticipated , when gas (GHG) secretions carry on current amount, temperature of Earth's surface could go beyond past standards like before time as possible, with dangerous belongings over bionetwork, biodiversity & the existing circumstances of individual altogether ended globe. "Author stated , whether change or climate change impact on world .
9) S.Lakshmi Sai Rama Krishna (2016) discuss about the global warming as this a main global problem of world. The author stated about the environment problems and issues . Gas emission that will impact on environment. The author stated global warming is due to greenhouse gases emission
10) Anuleena Bhattacharjee (2016) The author stated about health issue and climate changes . Author stated about the how is going the climate change impact on health. Author says in this paper is discussion about need of time to secure and steady environmental is to be sustained for the present and future generation to live in.
After the reading the article we study and analysis the pollution related information
ORDER NEW COPY OF ITECH7406 DATA ANALYSIS ASSIGNMENT & GET HIGH QUALITY SOLUTIONS FROM SUBJECT'S TUTORS!
DASHBOARD
This section we are going to discuss about the discuss the SAS BI tool and Dashboard. The SAS tool is use for Big data. The SAS tool is online tool and easy to use . This tool having a GUI interface. This will help to generate the chart with few clicks. The SAS is interactive Dashboard. We need to open the data and prediction will work just few click . Our analysis and Dashboard is using SAS BI tool. There are various chart . We are going to discuss the chart using the information or dataset . Our data set we download from Kaggle website .The BI tool first cleaning and pruning the data set. Afterward analysis and chart prediction start. Air Pollution information that will impact on disease
M2.5 ,ozone and household air pollution all are responsible for 5 million deaths. In 2017 we can say , if 10 deaths happened 1 death is due to air pollution.[2]
In this section we are talking about the Household air pollution and deaths.
We analysis the contribution in deaths in 2017 globally 1.6 death occur due to Household air pollution and in percent we can 3% of the total death.
Fine particle air pollution
This is also known as ambient or outdoor PM2.5,. This air pollution due to vehicle emissions, coal-burning power plants, industrial emissions,[3] household energy use, and windblown dust or may be other sources is reason. As per analysis
|
Outdoor PM2.5
|
Household Air Pollution
|
Ozone
|
|
? ischemic heart disease
? stroke
? lower-respiratory infections (e.g., pneumonia)
? chronic obstructive pulmonary disease
? lung cancer
? diabetes*
|
? ischemic heart disease
? stroke
? lower-respiratory infections (e.g., pneumonia)
? chronic obstructive pulmonary disease
? lung cancer
? diabetes*
|
? chronic obstructive pulmonary disease
|
|
Electric Sector Rank
|
Total Industrial
|
Electric Sector
|
Electric Sector
|
Status of State
|
|
State
|
by In-State Toxic Air
|
Toxic Air Pollution
|
Toxic Air Pollution
|
Contribution to State
|
|
Mercury Regulations
|
|
Pollution
|
(lbs)
|
(lbs)
|
Toxic Air Pollution (%)
|
|
|
|
|
|
|
|
Ohio
|
1
|
68,863,474
|
44,545,704
|
65%
|
|
|
Pennsylvania
|
1
|
50,527,280
|
41,459,532
|
82%
|
|
|
Florida
|
1
|
49,039,948
|
33,442,431
|
68%
|
|
|
Kentucky
|
1
|
41,340,348
|
31,947,066
|
77%
|
|
|
|
|
|
|
|
|
Maryland
|
1
|
29,887,235
|
27,092,233
|
91%
|
?
|
|
Indiana
|
1
|
39,634,894
|
26,798,135
|
68%
|
|
|
Michigan
|
1
|
31,276,291
|
22,731,782
|
73%
|
?
|
|
West Virginia
|
1
|
25,493,261
|
21,486,688
|
84%
|
|
|
Georgia
|
1
|
41,902,848
|
18,246,617
|
44%
|
?
|
|
North Carolina
|
1
|
30,296,011
|
14,907,994
|
49%
|
?
|
|
South Carolina
|
1
|
26,774,040
|
11,453,391
|
43%
|
?
|
|
Alabama
|
2
|
28,573,077
|
11,418,246
|
40%
|
|
|
Texas
|
2
|
39,442,151
|
10,155,177
|
26%
|
|
|
Virginia
|
1
|
25,205,367
|
9,649,281
|
38%
|
|
|
Tennessee
|
1
|
25,070,569
|
8,864,747
|
35%
|
|
|
Missouri
|
1
|
12,011,626
|
6,360,329
|
53%
|
|
|
Illinois
|
1
|
23,917,015
|
5,583,222
|
23%
|
?
|
|
Wisconsin
|
2
|
12,810,181
|
3,451,772
|
27%
|
?
|
|
New Hampshire
|
1
|
2,633,143
|
2,519,676
|
96%
|
|
|
Iow a
|
4
|
15,370,670
|
2,486,771
|
16%
|
|
|
Toxic 20 Total
|
1
|
620,069,428
|
354,600,794
|
57%
|
|
|
U.S. Total
|
1
|
771,580,707
|
381,740,601
|
49%
|
|
SAVE TOP GRADE USING ITECH7406 DATA ANALYSIS ASSIGNMENT HELP SERVICE OF EXPERTSMINDS.COM!
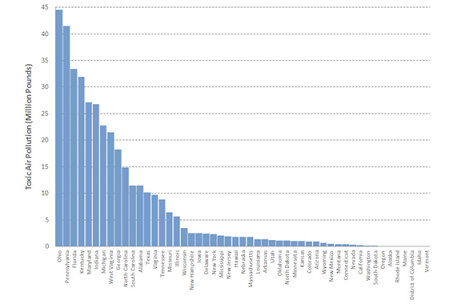
We are analysis quality of the air breathe according to given data . Environmental Protection Agency is regulatory agency for keep an eye for pollution. The agency were created the Clean Air Act as a means of achieving cleaner, healthier air in 1970. They created a standards for the protect the people health from air pollution is known as National Ambient Air Quality Standards. This act is subjected is created for reduce the level of harmful emissions that result from nasty air pollutants.
This table is showing the information about the most polluted state per 100,000 people:
Air pollution (ug/m3):
|
Rank State Pollution Information
15 North Carolina Air pollution : 12.99
Cancer diagnoses 448.8
14. South Carolina Air pollution (ug/m3): 13.16
Cancer diagnoses 433.3
13. Mississippi Air pollution : 13.16
Cancer diagnoses 462.1
12. Virginia Air pollution : 13.26
Cancer diagnoses per 416.5
11. Georgia Air pollution : 13.3
Cancer diagnoses 453.4
10. Pennsylvania Air pollution : 13.35
Cancer diagnoses 477.3
9. Illinois Air pollution : 13.38
Cancer diagnoses 460.4
8. Maryland Air pollution : 13.47
Cancer diagnoses 439.5
7. Washington, D.C. Air pollution : 13.58
Cancer diagnoses 442.4
6. West Virginia Air pollution : 13.76
Cancer diagnoses 461
5. Alabama Air pollution : 13.95
Cancer diagnoses 437.9
4. Tennessee Air pollution : 14.02 Cancer diagnoses 445.7
3. Kentucky Air pollution : 14.1
Cancer diagnoses 513.7
2. Ohio Air pollution: 14.23
Cancer diagnoses 452.1
1. Indiana 14.36
Cancer diagnoses 435.8
|
|
DO YOU WANT TO EXCEL IN ITECH7406 DATA ANALYSIS ASSIGNMENT - ORDER AT EXPERTSMINDS!
According to our analysis shows that two types of air pollution ozone and particle pollution is in dominate in the U.S.
We are working on our dataset that is focus on SO2 and O3 gas. As we are doing analysis using BI tool , we found state Los angel is in top position in America in the pollution.
According to our study pollution is impact on health issues. The people of America faces the health issue and they invest their money for the health. Due to this pollution people affected by diseases like lungs cancer and lots of deaths due to these pollution factor.
The impact of NO2 increase the respiratory tract infection through the air pollution .This gas is also impact the immune system. We analysis the number of data find out the effects of large scale exposure to NO2, SO2, and CO have failed to find associations with adverse health result. So2 Gas is an invisible gas .
Now first we are discussing the greenhouse gases main gases responsible for greenhouse effect
- Water vapour (H2O),
- carbon dioxyde (CO2).
These three other gases also impact on greenhouse that are changing due to rapidly growing industries.
- methane (CH4)
- Nitous oxyde (N2O),
- ozone (O3), which molecule comprises 3 oxygen atoms
In this table we are giving the information about green gas in the atmosphere
|
Gas
|
Approximate residence time in the atmosphere
|
|
CO2
|
100 years
|
|
Methane (CH4)
|
12 years
|
|
Nitrous Oxyde (N2O)
|
120 years
|
|
Halocarbons (CnHalp)
|
from several weeks up to 50.000 years
|
|
Gas
|
Formula
|
Carbon equivalent per kg
|
|
Carbon Dioxyde
|
CO2
|
0,273
|
|
Methane
|
CH4
|
6,82
|
|
Nitrous Oxyde
|
N2O
|
81,3
|
|
Perfluorocarbons
|
CnF2n+2
|
2.015 à 3.330
|
|
Hydrofluorocarbons
|
CnHmFp
|
34 à 4.040
|
|
Sulfur hexafluoride
|
SF6
|
6.220
|
|
Gas
|
Formula
|
relative GWP / CO2 (100 years)
|
|
Carbon Dioxyde
|
CO2
|
1
|
|
Methane
|
CH4
|
25
|
|
Nitrous Oxyde
|
N2O
|
298
|
|
Perfluorocarbons
|
CnF2n+2
|
7400 to 12200
|
|
Hydrofluorocarbons
|
CnHmFp
|
120 to 14800
|
|
Sulfur hexafluoride
|
SF6
|
22800
|
These are chart that we are using for prediction. These data set is more focus for analysis s we study and analysis the article about pollution reason and heath issue Due to NO2 health issues is coming. This NO2, SO2 both are responsible for the heath issue and impact to earth environment layer.
DON'T MISS YOUR CHANCE TO EXCEL IN ITECH7406 DATA ANALYSIS ASSIGNMENT! HIRE TUTOR OF EXPERTSMINDS.COM FOR PERFECTLY WRITTEN ITECH7406 DATA ANALYSIS ASSIGNMENT SOLUTIONS!
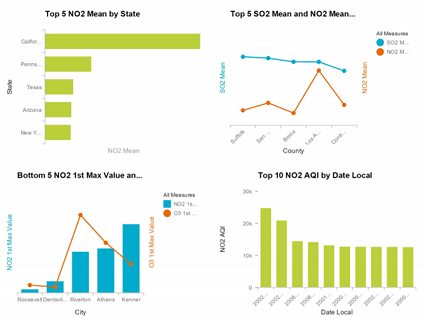
In California state NO2 Gas found in maximum level[5]. It very harmful for air and spread the pollution. California state is top position in NO2 Gas. In New York state NO2 Gas found is not listed in high rank. Roosevelt is bottom position regarding NO2 Gas . Riverton city is a NO2 Gas in high position a bottom city
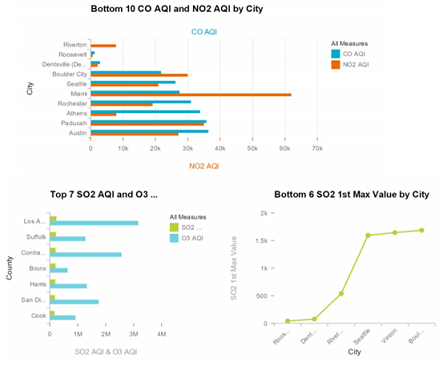
SO2 and O3 gas found in state Los angel and it top position in America. The last position is cook in O3. SO2 exposure causes changes in airway physiology, including increased airways resistance The impact of NO2 increase the respiratory tract infection through the air pollution .This gas is also impact the immune system. We analysis the number [6]of data find out the effects of large scale exposure to NO2, SO2, and CO have[8] failed to find associations with adverse health result. So2 Gas is an invisible gas .
According to study and analysis of article , we can say these air pollution is going to impact on the health issue . This will be going to impact on environment layer. Due to this pollution rate is going to high. The premature death rate is high. The average life span of human is going to low
Justification
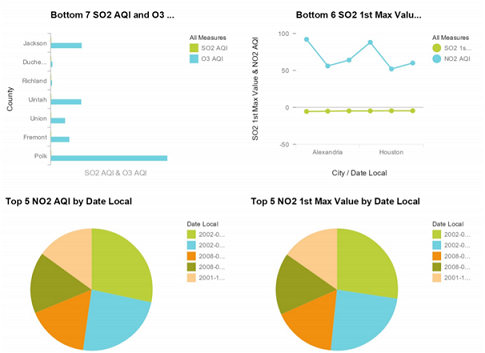
As per article review we analysis our dashboard . These dashboard chart is also showing the greenhouse gases changes. The chart gases variation shown impact on environment or global warming. These graphs are showing the information about countries who produce air toxic pollution . According to our article review these information greenhouse gases NO2 and
CO2 country wise . These chart showing the effects of large scale exposure to NO2, SO2, and CO2 all information indicate the environment or climate changes . Our table information is justify the environment changes or climate change.
WORK TOGETHER WITH EXPERTSMIND'S TUTOR TO ACHIEVE SUCCESS IN ITECH7406 DATA ANALYSIS ASSIGNMENT!
Conclusion
In this paper we studied and analysed pollution and their effect .We study the data set from Kaggle website that is in the form of csv file. We download the data and using BI tool we complete the analysis . These analysis is based on air pollution factor. As per our analysis
The top ranking state is Indiana in the term of air pollution. As we focus on pollution factor NO2 ,O3 . We find top most ranking in pollution state is Ohio. These factor are showing pollution is increasing and pollution increasing due to various factor .Our data set is more focus data set hence we got more relevant result in the term of prediction. Our prediction is based on BI tool. Our BI tool is easy to use and basic. This tool having a GUI interface and hence working on this tool is easy . The first step is load the data and then just pressing the few button we gather the result about our data set. According to our analysis the Day by day it's bad effects are increasing and so on causing more problems for us. We summarize our discussion with now we need to change new policies that will regulate the environment changes As we study and analysis ten articles and books all emphasis on their is a need to law that will regulate the industries to control the climate changes.
Recommendation
Letter to CEO
To
The CEO
......
..........
May 30, 2019
Sub: Health issue due to Air Pollution
Sir,
I wish to draw the attention of the authorities
Today, as we know Air Pollution is very harmful for us. It's harmful for our present and future. So we should take measure steps to reduce it. As we analysis the data we find out the Power-plant of U.S.A is responsible for the 12% of total air pollution Air Pollution is caused by increase in emission, noise pollution and It causes problems in human's life like health problems, Water balance ,climate change etc. . According to analysis there are numerous premature deaths due to the pollution It can be prevented by using bio fuel . "MAKE EARTH Free from Air Pollution" . The authority should also pay attention by making various awareness programmers ,time to time.
I wish authority will to do something to regular Air Pollution
Thanks and Regards
A b c
A x x
EXPERTSMINDS.COM ACCEPTS INSTANT AND SHORT DEADLINES ORDER FOR ITECH7406 BUSINESS INTELLIGENCE AND DATA WAREHOUSING ASSIGNMENT - ORDER TODAY FOR EXCELLENCE!
Solution 2: Plastic Global Marine Pollution World Wide
Abstract
The plastic pollution is nowadays become a crisis globally and so we have to analyze this crisis. To analyze the effect of plastic deposit on the marine pollution IBM Watson analysis was performed various questions and the latitude spread of the Plastic material was compared . The result and discussion were discussed in the result analysis. The conclusion made was the safer disposal of the plastic.
INTRODUCTION
Plastic is a non biodegradable long chain compound when it is dumped into the land, water and surrounding it gets polluted. Nowadays plastic pollution has become a trending crisis worldwide (Chris Johnsoin, 2000). Nearly millions and trillions are being dumped into the land as such and into the water bodies over the country. The plastic thrown in to water bodies are floating like anything depleting the oxygen in the water and affecting the marine life. Many of the water living bodies are dying yearly. The plastic dumped into oceans and beaches are increasing day by day (Chris Johnsoin, 2000). We can find only plastic floats in the oceans instead of the planktons and lettuce we find plastic plants in the ocean and beaches. the most affected are the ocean nearly 40 percent of the plastic are found swilling in convergences in the ocean. As plastic gets more and more accumulated in the ocean it will definitely outweigh the marine livi9ng especially fishes out of the ocean by 2050.
Plastic pollution has a deadly effect on wildlife in the marine nearly many of the water living wildlife turtles, sea birds, seals and fishes die because of ingestion of plastic and getting caught into year after year the problem is increasing. Nearly 700 to 1000 species caught into plastic endangers in the pacific ocean (Chris Johnsoin, 2000). The endangered species Hawaiian monk seals and pacific loggerhead sea turtles. In this paper we are going to make analysis using IBM Watson analysis to know how the plastic deposit affects the marine living. What are the marine wildlife affected by the deposit. What are the effects of the deposit on the marine living. How the marine are affected by the deposit. The questions are going to analyzed using the IBM Watson statements analysis and the results are to be discussed.
The Problem is Plastic
Growing population disposes the plastic , mostly people spend their weekends, vacations and holidays in the beaches with their family. The people take packed food , packed during water bottles ,juice bottles all packed and made out of plastics. People just throw aside the plastic waste after using in it in the water body sides (Chris Johnsoin, 2000). The winds direction takes away the plastic waste left in the landfill into the ocean. In the past decade all were made out of plastic and we said all plastic every were. In 2000 all were surrounded by plastics and so what happened billions of plastic got loaded in the ocean. It is estimated approximately that there around 15-51 trillions of the plastics upon the ocean from equator to pole, arctic ice capes to sea. It is estimated that not even a square mile of the earth is free from plastic.
The problem of plastic pollution is that it is not biodegradable and the pollution has become a crisis in and around the globe. The fossil fuel industry are in continuous production of plastic and the growing demand for plastic has increased in the past decades. The EPA reports that" plastics made a bit will exists for long and till now (Chris Johnsoin, 2000)."
The Garbage patch as an example in pacific from globe map
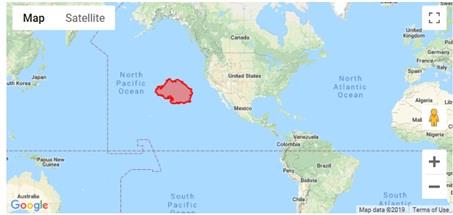
The pacific garbage is shown as a red patch in the ocean.
Effect of Plastic Accumulation on wildlife
The plastic accumulation has affected the wildlife in the ocean . Thousands of wildlife species gets affected like blue whale, small fishes .
Fish
The fish in the marine north pacific region ingest 12000 to 24000 tons of plastic waste gets accumulated in the ocean which causes serious injuries in the intestine and death. The small fish ingest and from their it is transferred to big mammals and human sea food eaters (Chris Johnsoin, 2000). The marine market in the northern California found most of the fish when cut found by plastic in the guts and found as plastic microfibers.
What happens in case of sea turtle is that they mistake the plastic garbage to be the food. They ingest those floating garbage thereby their intestine gets damaged finally leading to death. The plastics get choked in the intestine causing injury to intestine and die. Studies indicate that half of the sea turtles has ingested plastics worldwide. It is estimated that hundreds of sea birds ingest plastic every year. Plastic ingestion causes the stomach to be filled of half volume and thereby causing starvation. It is estimated from the study that the 60 percent of the sea animals have ingested plastic and it will increase to 90 % of plastic ingestion by 2050 (Chris Johnsoin, 2000).
Empirical View on Plastic Pollution
The global production of plastic was less in til 1950. But during the next decade plastic production was increased and nearly 350 trillions of plastic was produced by 2015 which is roughly equal to two third of population. Overall 90 percent of the marine pollution is due to landfill sources and only 10% percent accounts to marine source. In 2010 the global primary plastic production was 270 million tons and this count increased to 275 millions within a year due to plastic waste in the environment. Plastic waste into ocean main source is the coastal source from coastal people pollution .In 2010 the coastal plastic ocean pollution accounted to 99.5 million tones (Hannah Ritche, Maxrover, 2018). The plastic waste that is in a condition of mismanagement caused most of the pollution to the ocean and it accounted to 56.5 million tones. Nearly 8 million tones of the plastic waste entered in ocean per year. As estimated globally 10000 to 100000 million tones of the plastic waste are into the ocean annually (Hannah Ritche, Maxrover, 2018).
NEVER BE CAUGHT IN PLAGIARISM, AVAIL ITECH7406 BUSINESS INTELLIGENCE AND DATA WAREHOUSING ASSIGNMENT HELP SERVICE OF EXPERTSMINDS.COM AND SAVE HIGHER MARKS!
Global Plastic Production
As assumed plastic production were 2 million tones per year from 1950. But it gradually increased from 2oo million to 381 million in 2015 because of the growing population and the demand for packaged item right from grocery to food all in plastic packaging has also increased. For every person of the living the cumulative plastic production accounts to 7.8 billion tones of plastic annually.
Global Plastic fate the disposal
In 2015 the disposal and incineration rate increased for plastic waste disposal 55 percent was disposed,25 was incinerated and remaining 20 percent was recycled. By 2050 the incineration and the disposal percentage would increase. The marine living and the ocean will be plastic prone if this trend of plastic disposal and production continues.
The littered Plastic Waste
The littered waste is different from the disposed waste. The plastic waste littering is not dumping of all plastic waste into the ocean (Hannah Ritche, Maxrover, 2018). The plastic is used in all sectors we may not account to the plastic produced by all sectors are dumped into ocean only certain waste are dumped. Almost only packaged waste are being dumped into the ocean and the quantified plastic waste generated are being dumped into the coastal population are being dumped into the ocean. We may not quantify the entire coastal population is accountable for the marine population. The people population visiting the oceans as tourist and the weekend times in beaches are also the cause of the ocean pollution by packaged plastic. Nearly 90% of the ocean is covered by PET bottles and PE packed bags floating. These polyethylene packing bags are mainly eaten by the marine animals as they think that to be their food (Hannah Ritche, Maxrover, 2018).
Methodology
The methodology includes a survey of the marine pollution using the IBM Watson dataset and the trends in plastic marine pollution were studied and the data input were given in the IBM Watson itself. The analysis was carried out for various questions regarding the usage and disposal of the plastic world wide as the trend in the plastic disposal is increasing worldwide and the plastic disposal in marine has increased in the past decade we can't simply say pollution we need to have a data analysis for this report so we created the database in the IBM Watson and the results analyzed were discussed in the results discussion (Hannah Ritche, Maxrover, 2018). The world wide data shows that 85000 million of plastic production world wide from 2015 . Since the packed food numbers has increased the packaging plastic covers, packaged drinking water has also increased and the turner over of the plastic packaging industry is also high (Hannah Ritche, Maxrover, 2018). Most of the population prefer packed food instead. The trend for the plastic production increased the demand for packaging related item has also increased in recent years.
Exploring Datas in IBM Watson
IBM Watson gives an visualization exploration of the datas on the Plastic pollution in the Marine. The exploration gives the dataset on the visualization of the graph, histogram and pie chart for the analysis of the data. IBM Watson analysis is used analyzing the worldwide trending data (Environmental sustainability is smart for all IBM report, 2017). The software has a database where the sets of the data are entered into the software and the data analysis is performed using the given dataset and the clear view for the analysis of the plastic marine pollution Globally is obtained.IBM reviews it analysis both internally and externally on the environmental impacts.
Results and discussion
1. What is the trend of the number of info over date by text?
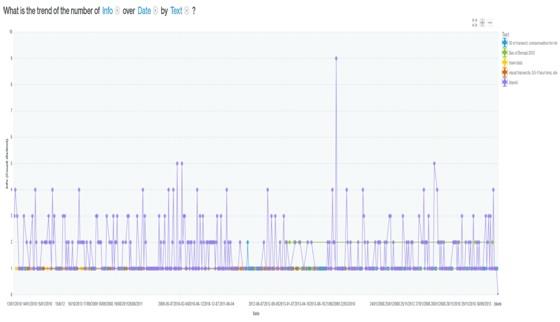
The increase in disposal increase in the plastic waste ocean in trend as years to come . the dumping of the plastic waste from the decades is increasing. Growing population has also accounted for the increase in the plastic waste . over the years the billion has turned to trillion of the disposal in the coastal and in the ocean. The graph above also predicts the increase in the trend of the plastic according to date increases in the filling in the ocean .Large number of the plastic swirls round the ocean as the days and years increase. In 2015 the 380 trillions of the plastic was found to be dumped into the ocean. Still more dumping will take place in years to come. From 2010 to 2015 the rise of the plastic dumping into the ocean was high in comparison to the date. The marine life will become distinct if this continues. The dataset analysis the plastic pollution in bay of Bengal were number of dumping takes place.
DO WANT TO HIRE TUTOR FOR ORIGINAL ITECH7406 BUSINESS INTELLIGENCE AND DATA WAREHOUSING ASSIGNMENT SOLUTION? AVAIL QUALITY ITECH7406 BUSINESS INTELLIGENCE AND DATA WAREHOUSING ASSIGNMENT WRITING SERVICE AT BEST RATES!
2. What is the number of rows compare to sea state
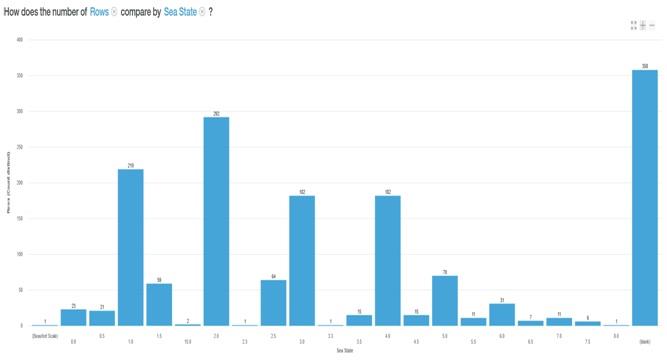
The sea state are more prone to marine pollution as these are near the coastal area and the population in the marine are also increasing and the pollution is also increasing in percentage in recent trend the plastic pollution if compared in state wise in the coastal will show a increase in the pollution . There will no change in the increase of the population as well as production and as well as increase in the dumping also increases. The coastal states in the bay of Bengal account for the most of the tourist spot. The main spot Chennai if taken into consideration the tourist spots like marina and the mahaballipuram near to the coastal area are highly polluted by the usage of the plastic packaging products during the visit of the tourist. The state wise comparison for the date predicts a rise in pollution only . the dumping in this coastal area are more when compared to other areas as these coastal areas are visited by people more often . The population in the coastal area is high when compared to other land areas. The coastal areas has also got many industries near the beaches and the ocean.
3. What is the predictive model for the source?
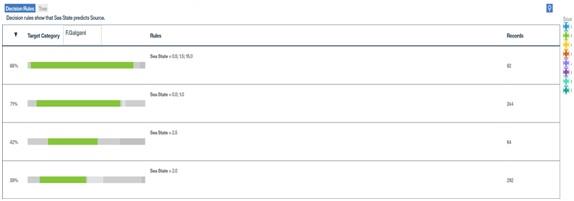
The predictive model from the source is the landfill was the plastic pollution occurs from the land source to the ocean by wind blowing from land to sea. The packaged bottles, the covers, the plastic plates, plastic cups get transferred into the ocean through the wind and the waves. the waste are collected and they float to the deepest of the sea were the aquatic live their living and so be aware not use plastic if they are not disposed safely into the environment . The fishing of plastic is going to take place in near years to come. The main plastic pollutants are the Nylon net used by the fisherman to catch when these net gets cut they are left over and so many turtles get stuck in this nylon net and die. The plastic covers gets stuck in the marine animals face and so breathing becomes difficult. So the source if kept clean these types of effects may be reduced.
4. What is the Trend of the number CD4/Km2
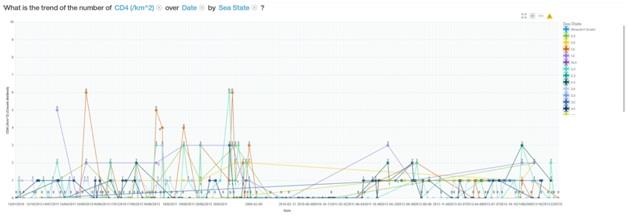
The CD4/Km2 trend indicates the increase in the plastic marine pollution increase with CD4/K m2. The micro plastic are present more than a trillion in number in the marine water . Since these are not biodegradable their properties degrade and the amount gets reduced to million microns that also can affect the marine life in the ocean. The state wise micro plastic count has also increased in the years and the billion count of them are being found in worldwide ocean.
5.What is the trend of the number of WD1(g/Km2)
The number of count of the CD over WD1 is increasing in number due to plastic packaging materials being dumped into the water bodies the plastic packing bodies when gets depleted some of the chemical chains present in the plastic changes can liberate the carbon chain gets disturbed making the unavailability of the oxygen to the marine living. The metals are also distributed over the sea in the marine sea and its spread over was kilometer. The carbon spread over the ocean is same over the green spread. The carbon spread is as equal to the green spread over the ocean all the level of the spread all over the ocean world wide.
6. What is the latitude of the CD2/Km2
The CD2 /Km2 latitude is shown in different colors in the circle each color depicts the latitude of the spread in the ocean . The calcareous deposit are the wide spread deposits that help the marine life survive if the plastic materials inhibits the ocean this calcareous deposit will get depleted and the marine living gets affected as these plastic deposities will not allow the sunlight to pass and there by decreasing the oxygen level leading to death of the marine level and the marine will float as such.
7. What is the number of latitude for each source
The latitude for each source will vary according to latitude the deposits effect will vary
Conclusion
The ocean is the beauty of the nature; almost 99% of the earth is surrounded by water. The ocean brings rain to the country on to the vaporization and if it gets contaminated by the plastic deposits it will affect the marine life what if the marine life gets affected. The marine life will get injuries due to ingestion of the plastic into the intestine and when swallowed it gets accumulated into the animal body thereby causing injury to the entire system and die finally. Thousands of turtles, fishes and the sea seals die in a year over the globe due to plastic marine pollution so the CD4/km2 and WD1/gKm are also varying and depleting due to the hydrocarbon depletion of the plastic into the ocean. In ordered to prevent the marine from the pollution we need to safely dispose the plastic in bins and the usage should be reduced to a minimum in years to come. The depletion of the ocean wildlife causes small in the surrounding thereby contaminating the marine and the environment leading to many sort of diseases. Safe disposal of the plastic packaging material is very important in the environment. If we reduce our own use of plastic itself will reduce the pollution in the marine deposit so Single-use plastics include plastic bags, water bottles, straws, cups, utensils, dry cleaning bags, take-out containers, and any other plastic items that are used once and then discarded. Only certain plastics can be recycled not all plastics be recycled .this single use plastics cannot be recycled so our first aim in reducing this single use by avoid using it. The most affect are sea turtle, whales and many mammal in the sea. To keep the ocean green and off from pollution we should go green.
SAVE YOUR HIGHER GRADE WITH ACQUIRING ITECH7406 DATA ANALYSIS ASSIGNMENT HELP & QUALITY HOMEWORK WRITING SERVICES OF EXPERTSMINDS.COM!
Hire Expertsminds Tutors and get best Federation University, Australia Assignment Help Service for other courses and units such as -
- ITECH1000 - PROGRAMMING ASSIGNMENT HELP
- ITECH1001 - COMMUNICATIONS AND TECHNOLOGY ASSIGNMENT HELP
- ITECH1002 - NETWORK OPERATING SYSTEMS ASSIGNMENT HELP
- ITECH1003 - NETWORK PROTOCOLS & SERVICES ASSIGNMENT HELP
- ITECH1004 - INTRODUCTION TO MULTIMEDIA ASSIGNMENT HELP
- ITECH1005 - BUSINESS INFORMATION SYSTEMS ASSIGNMENT HELP
- ITECH1006 - DATABASE MANAGEMENT SYSTEMS ASSIGNMENT HELP
- ITECH1100 - UNDERSTANDING THE DIGITAL REVOLUTION ASSIGNMENT HELP
- ITECH1101 - IT PROBLEM SOLVING ASSIGNMENT HELP
- ITECH1102 - NETWORKING AND SECURITY ASSIGNMENT HELP
- ITECH1103 - BIG DATA AND ANALYTICS ASSIGNMENT HELP
- ITECH1104 - CLOUD AND ENTERPRISE COMPUTING ASSIGNMENT HELP
- ITECH1300 - MOBILE COMPUTING PLATFORMS AND DEVELOPMENT FUNDAMENTALS ASSIGNMENT HELP
- ITECH1400 - FOUNDATIONS OF PROGRAMMING ASSIGNMENT HELP
- ITECH2000 - MOBILE DEVELOPMENT FUNDAMENTALS ASSIGNMENT HELP
- ITECH2001 - GAME DEVELOPMENT FUNDAMENTALS ASSIGNMENT HELP
- ITECH2002 - SYSTEMS MODELLING ASSIGNMENT HELP
- ITECH2003 - WEB DESIGN ASSIGNMENT HELP
- ITECH2004 - DATA MODELLING ASSIGNMENT HELP