DO YOU WANT TO EXCEL IN DATA ANALYTICS ASSIGNMENT? HIRE TRUSTED TUTORS FROM EXPERTSMINDS AND ACHIEVE SUCCESS!
ITECH7407 Real Time Analytic - Federation University
ANALYTIC REPORT
This is a business analytics project aimed at generating innovative analytics solutions for a WHO (World Health Organization.
ARE YOU LOOKING FOR RELIABLE DATA ANALYTICS ASSIGNMENT HELP SERVICES? EXPERTSMINDS.COM IS RIGHT CHOICE AS YOUR STUDY PARTNER!
Real Time Analytic Data Analytics Assignment
Introduction
The following report has extracted data from the WHO (World Health Organization)- Open Data Repository, and specifically chosen the reports related to Australian Health reports. The dataset will be analyzed thoroughly to make the CEO of the health organization Australian Academy of Health and Medical Sciences. It is an academic institution who gives advices to the Australian Government in making changes in medical sciences and the practices the medical researchers can do within the organization to improve the overall Health Standard of Australia. The dataset will be analyzed by the tool SAS predictive analysis, and by the use of BI tool it will replicate the data to be stored in a synchronizedmanager for the better extraction and for the application of research and developing medical practices. The end of the report will be given a suggestions and recommendations related to the usage of data and SAS predictive analysis in maintaining data and ensuring them in the usage of better practices.
EXPERTSMINDS.COM ACCEPTS INSTANT AND SHORT DEADLINES ORDER FOR DATA ANALYTICS ASSIGNMENT - ORDER TODAY FOR EXCELLENCE!
Task 1- Write a description of the selected dataset and project, and its importance for your chosen company. Information must be appropriately referenced.
Solution:
The dataset chosen here reflects the Australian Health statistics, which covers the most prone diseases among the Australian population. The most common cause for deaths in Australia is by suicides and most less is by getting infected by HIV/AIDS. It has also described the Gross national income of the Australian people. The treatments recalled to the various diseases and the income according to the treatment are verified. The deaths due to diseases like Tuberculosis, maternal labor and the hospital beds needed every year for the treatments of certaindisease has been portrayed in the data set.
It can be said that it is Sparse data set and has been build according to the Sparse matrix, as the attributes in the data set are not co-related but aligns to the same type of situation. A Sparse data matrix is the type of data where the attributes and values of the data are different and are nit synchronized but somehow interrelated to each other. The data is comparatively large and therefore large data sets are considered to be accurate as many data set has been added and updated throughout the years which clarifies the data set and the information within the data set.
Further analysis shows that most of the data sources are portrayed by symbols according to data and time. Through the data set we can assume that variable used are GDP, or disease rate, mortality rate and are described throughnumerical basis or through ratios. The disadvantage of this data is that it is quite overlapped as they have different attributes.
The importance of the data set to the organization
This data set will give an overall view of the mortality rate dues to diseases like HIV/ Aida. Tuberculosis, or material complications, suicides etc. this will help the institution in getting an insight about the condition of the country and the changes needed to make the country a better standardized place for the human being to live in. The data set will alsohelp in analyzing the GDP, by which the average earnings of the population will be analyzed and the medical conditions they are prone which will also give an insight about the tendency in getting full treatment. The treatment procedures for serious disease are quite high which prevent many peoples from getting the required treatment. The Australian Academy of health and medical sciences will have to analyses this issues to create opportunities for the people, as they report to the Government, this can improve the employability rate and te tendency of treating their disease. The medical practices can be profound by the use of this data set as it will help the in finding cheaper medical facilities that can helps all level of people to get treatment , improving the overall development of the company.
SAVE YOUR HIGHER GRADE WITH ACQUIRING DATA ANALYTICS ASSIGNMENT HELP & QUALITY HOMEWORK WRITING SERVICES OF EXPERTSMINDS.COM
Task 2 - Perform Data Mining on data view
Upload the selected dataset on SAP Predictive Analysis. For your dataset, perform the relevant data analysis tasks on data uploaded using data mining techniques such as classification/association/time series/clustering and identify the BI reporting solution and/or dashboards you need to develop for the operational manager of the chosen company.
Solution:
The data set will be uploaded on the SAP Predictive analysis as, it is considered to be the most preferable platform for generating models and visualization and giving an appealing image to the user who extract the data and get an idea to implement on the practical field. The data has been given related to the Australian health reports. The steps hereby will show the uploading of the data set into the SAS visual analytics. They are as below:
First step- Data Importing
There is an option related to Data Management tab, this helps in importing the data sources as well as the data top transform them in an appealing visualization for better understanding.
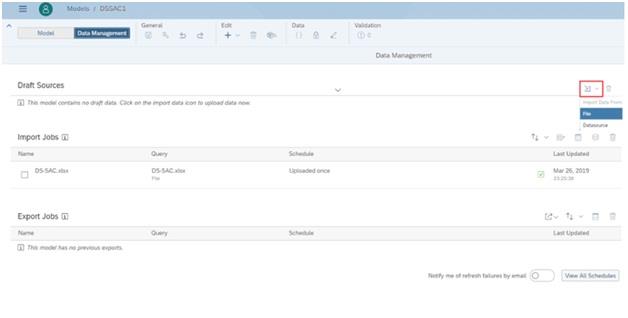
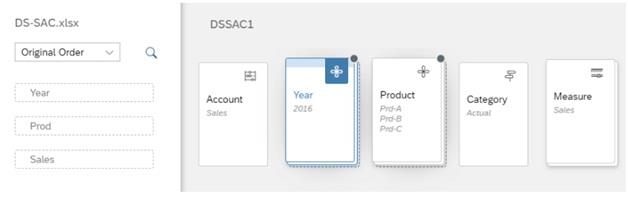
The field names are automatically checked and linking can be done manually.
There are generally four types of methods in which the data can be imported, by selecting the preferable option there can be start in mapping.
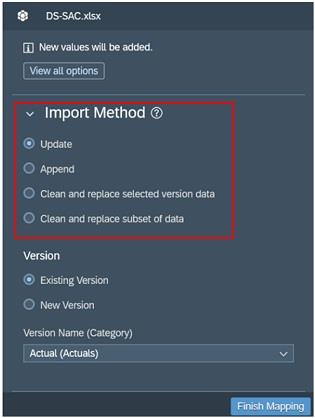
The various methods of importing are as follows:
Update
• The records are uploaded prior to any changes
• Then the facts are updated with new addition to the data
Append
• New records are added to the already existing sets
• The new values are segregated with old ones
Replace the existing data set with new updating
• The records that were recorded in the old files are remained in the old files and new files are created
• Updated facts are uploaded
The strategies that can be applied in the data mining of records, are that new data must be retained, old records will not match the new tuples, and the records will also not match the new ones with the old ones.
In case of the dataset used in the report there will be no change in the data's, therefore the data uploaded on the SAS analytics will predict the visualization and present model according to the assumptions in the visual analytics platform of SAS.
Specific data mining tools and algorithms will also be applied in the report, which will represent the exact knowledge of the data. The knowledge can be related to associative rules, rules regarding characteristic attribute in the dataset, and clustering them by explaining the processes in which the data set will be represented. In case of clustering or unsupervised classification, it is done by processing the data physically which has similar objects. A data set having N tuples will be represented by m clusters. The denomination for the cluster analysis will be done by representing the values by P(n, m).. The algorithm for the cluster will be
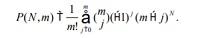
Figure 1: The cluster analysis algorithm
(Source:Aanderud&Kumpfmiller, (2017).
In case of Sampling methods, there are various procedures, they are random sampling which chooses different samples or objects that are given in the dataset. The other methods include the systematic and stratifies sampling. The simple sampling will be adapted in case of representing the Australian statistics, as it selected sample tuple by tuple, and giving random numbers to the samples. The preferred algorithm will also dedicate towards the sampling processes and selecting its output by random sampling methods. The algorithm is given below:

Figure 2: the algorithm for random sampling
(Source: Behrisch et al.,2018)
The sampling method will analyses the data from different levels and in different sizes to cater to the algorithm. The population criteria is also represented according to the diseases are also given in the data which can be represented through statistical processes. The statistics can be applied according to the calculation made by describing the mean and variance value. The key process in analyzing the statistics is the process in defining the outputs in relation to their inputs.
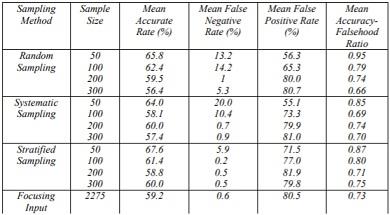
Table 1: the results of the data by the process of clustering
(Source: Created by the learner)
The visualization can be done by using the SAS Visual Analytics, the dataset can be uploaded according to the tuples. The use of Scatterplots, geomap , charts and bubble charts are the most preferable one in representing data. It has been observed that there will be clear representation of the data given in the dataset. This will help The Australian Academy to represent in a better way to the Government organizations to make them understand the necessary changes required in the medical field. The representation can be done using charts, geomap, scatterplots, or bubble charts to represent the importance of data set by the use of SAS visual analytics.
The representation will be done according to the data taken from the dataset, they are as follows:
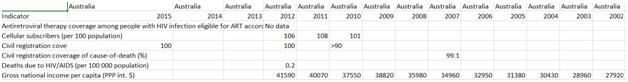
This dataset represents the civil registration coverage of death and the cause of death due to HIV/AIDS, and this it will be represented by the help of pie chart.
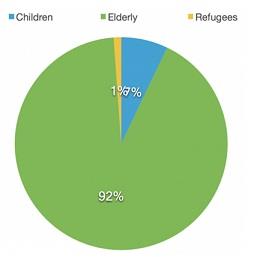
Figure 2: The representation of pie chart to show Australia maximum death rate
(Source: Created by the learner)
The pie chart has shown that the maximum death rate has been covered by the elder people, and the health hazards are quite less in compared to the young people. There are actions taken in Australia for immunizing maximum people to make them protected from germs and awareness programs are done for the decrease in the spread of HIV/AIDS. The organization can show this charts to the Government and raise awareness regarding the health standards. The development of the organization will help Australia in creating more facilities for the refugees as well.
In representing the Gross Domestic price and mortality rate in Australia will be represented in the form of Scatter plots which is the most commonly used charts in visualizing data. It has ben represented in the following process, it is given below:
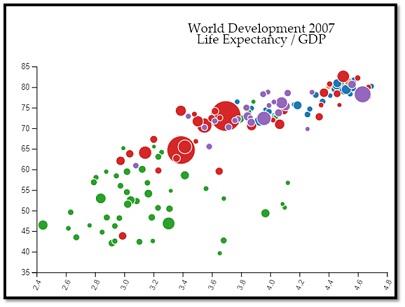
Figure 3: The representation of the data with the use of Scatterplot
(Source: Created by the learner)
In the next process, there will representation of the usage of the BI Tool in keeping the data sets and the record in according to their date, time or the dataset name. BI TOOL also known as the business tool is the most preferred tool of the business organizations for keeping records and accessing them in the required field. The BI tool gives the power to the user who can login with their ID and access the data. The advantage of the BI tool is that it helps in making the access secured., only the registered users can login to the BI Tool and can get access to the selected data and perform tasks like update, append etc. The security options of the tool have helped the numerous organizations in maintaining their records.
In handling big data like this data set of 10k have many challenges, they are numerous and sometimes hard to manage, it is very difficult to find results and create big data and bring out a required visualization of the file. It has been observed by the New vantage partner's big data executive survey 2017 that only 48.4 percent of the data analysis techniques go right and get successful. There are many disadvantages related to handling big data, they are as follows:
• The gradual growth in the data, as the data gets updated it grows
• Taking those big data and growing an insight related to managing of big data
• Validating data, which includes the integration of data so that they can create a valid visualization and it portrays the information correctly
• The big data needs a lot of security therefore in handling big data it is a huge problem
WORK TOGETHER WITH EXPERTSMIND'S TUTOR TO ACHIEVE SUCCESS IN DATA ANALYTICS ASSIGNMENT!
Task 3 Justify why you chose thee BI reporting solution/dashboards/data mining technique in Task 3 and why those data sets attributes are present and laid out in the fashion you proposed.
Solution:
The power BI Tool is the one which is cloud based platform for the conversion of turning raw data into visualization, it also helps in storing data and classifying them as well.; The strong security options have made it most preferable in using the data and making changes in the organization. It was developed by Microsoft is a collection of business intelligence by the use of visualization tools and services.
In the next process, there will representation of the usage of the BI Tool in keeping the data sets and the record in according to their date, time or the dataset name. BI TOOL also known as the business tool is the most preferred tool of the business organizations for keeping records and accessing them in the required field. The BI tool gives the power to the user who can login with their ID and access the data. The advantage of the BI tool is that it helps in making the access secured., only the registered users can login to the BI Tool and can get access to the selected data and perform tasks like update, append etc. The security options of the tool have helped the numerous organizations in maintaining their records.
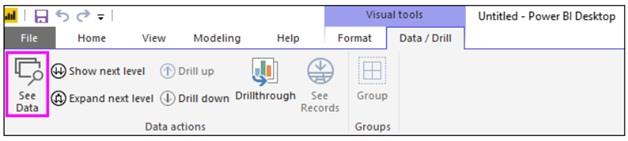
The power BI tool can be represented for creating visualization and storing data as well. It has been represented in the process of See Data and See Records tab. The clicking on the tab will represent the following options in which the data will be represented, the options are bar chart, pie chart, donut chart, filled map, funnel, map or geomap, column chart and tree map. See data also shows the data which represents the visualization.
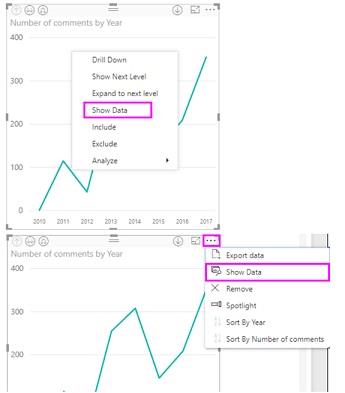
The visualization can also be shown by clicking the show data menu.
There is another option, by which we can see the data is More options ellipsis
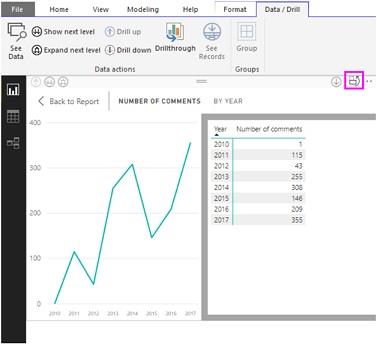
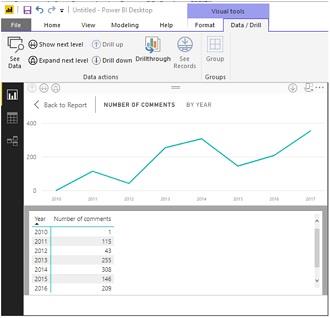
The selection proceeds by the process of BI desktop showing both the visual and textual representation and can be represented in a vertical or horizontal way.
Advantages of Using BI tool
• It has an affordable and reasonable price which helps in making changes to the data in both large and small organizations
• It helps in custom visualization and is widely available on the Microsoft website.
• There is option for uploading the excel sheets be it small data or huge data and can support many types of files such as excel, csv, xml, and json files
Disadvantages of using BI tool
• The configuration processes are poor in BI tool
• It has a crowded user interface
• The formulas are not flexible enough, and there are fluctuations in formulating the formulas
• It has problems in loading large data files
GET GUARANTEED SATISFACTION OR MONEY BACK UNDER DATA ANALYTICS ASSIGNMENT HELP SERVICES OF EXPERTSMINDS.COM - ORDER TODAY NEW COPY OF THIS ASSIGNMENT!
Task 4 - Recommendations for CEO
The CEO of the chosen company would like to improve their operations. Based on your BI analysis and the insights gained from your "Dataset" in the lights of analysis performed in previous tasks, make some logical recommendations to the CEO, and justify why/how your proposal could assist in achieving operational/strategic objectives with the help of appropriate references from peer-reviewed sources.
Solution:
The recommendations to the CEO of the Australia Academy of Health and medical sciences is the representation of the data is very necessary to be done minutely. The utilization of the data can be useful in understanding the rate of employability as well understanding the development areas that are highly needed in making changes to the overall health standards of the common people. The CEO of the organization can fulfill the goals and objectives by the use of data mining and implementing them in developing the research studies. This will help them, in making medical practitioners more aware of the situation andfindways to create the betterment in the country.
The goals of the organizationis to provide tactful data about the changes that are necessary in the medical field. The support they will get from the Government will help them develop the medical student and practitioners. The utilization of the various tools will also recommend them to preserve and their datasuccessfully, which will preventthem forgetting lost or leaked to unwanted person, the use of this tool will also help the organization as well as government to access give data to time the time of necessity.
The data will help them in making changes as well bring development in the field of employability, earnings, this will eventually create awareness against poverty, immigrants as well the medical facilities they are getting, This can be concluded by saying that it will help the organization overall to support the Governmentalorganizations to make conisderable4 changes in the country.
NEVER LOSE YOUR CHANCE TO EXCEL IN DATA ANALYTICS ASSIGNMENT - HIRE BEST QUALITY TUTOR FOR ASSIGNMENT HELP!
Task 5 - Write a cover letter to the CEO of the chosen firm with the important data insights and recommendations to achieve operational/strategic objectives.
Solution:
Dear Sir,
As a business analyst, I would like to recommend you the use of Data analytic stool in the processes of research study will helps in developing the overall development of the institution andit will help in analyzing the current trends that are happening in the country. According to that you can make changes or spread aw3asreness, or as well as start a specificclass to prevent this issues from coming up again.
In the process of data analysisthere are many tools whichcam be utilized to develop yourperformance of the medical sciences. Thefellowman ship given to the medical students have already make the institution a competitive one, But the inclusion of current data and utilizing them in the development if the studies, and catering to the latest trends in and happenings in the market can evaluate the whole process as developing the country.
The use of BI Tool and the SAS visual analytics have been used in many intuitions and organizations. The students can login with their user names and create account to see various data related to the medical history of the country Australia. The Bi toll will also help in keeping records of the data of the institution which will helps in preventing the complications of data.
As Government s dependent on this type of academic organizations and the youth incline to this instruction for their development. It will highly moral act is the Government is also aware about the utilization of such tools in keeping adept and implementing in making further changes to the organization.
Yours Sincerely
[name of the student]
Conclusion
The report has stated the dataset of an Australia medical represented in the WHO site, It was analyzed and explained in a detailform, and the data set was also uploaded in the SAS predictive analysis so that they can get used to visualization and representing them in visualization willhelp the Australian academy of medicalsciences in better understating of the situation in the country. The use of this type of tools can protect the data and can be set according to the requirement. The reporthas shown snapshots of BI Tool and given visual representation to portray the data in a much better way. The cover letter in the end is the proposal to the CEO about the usage of dataset in changing the medical practices and making further growth in the medical field to increase the standard of living.
ORDER NEW DATA ANALYTICS ASSIGNMENT & GET 100% ORIGINAL SOLUTION AND QUALITY WRITTEN CONTENTS IN WELL FORMATS AND PROPER REFERENCING.
Below are the related courses in which ExpertsMinds precisely deal with:
- ITECH 7408 Social Media Strategy and Management Assignment Help
- ITECH 2000 Mobile Development Fundamentals Assignment Help
- ITECH 5404 Business Process Analytics and Change Assignment Help
- ITECH 1001 Communications and Technology Assignment Help
- ITECH 7201 Software Engineering-Analysis and Design Assignment Help
- ITECH 3501 Principles of Software Engineering Assignment Help
- ITECH 1006 Database Management Systems Assignment Help
- ITECH 5500 Professional Research and Communication Assignment Help
- ITECH 1103 Big Data and Analytics Assignment Help
- ITECH 5403 Comparative Programming Languages Assignment Help