GET BENEFITTED WITH QUALITY CASE STUDY - MAD DOG CRAFT BEER ASSIGNMENT HELP SERVICE OF EXPERTSMINDS.COM
MIS771 Descriptive Analytics and Visualization - Deakin University
Learning Outcome 1: Apply quantitative reasoning skills to solve complex problems.
Learning Outcome 2: Use contemporary data analysis and visualisation tools and recognise the limitation of such tools.
Question:
Topic Mad Dog Craft Beer Project - Analytics Details
Q1. Provide an overall summary of the following two variables:
1.1. Order_Qty
1.2. Recommend
Q2. Identifying potential factors that may influence Order_ Qty:
Q3. Finalise the model to predict the likelihood of recommending Mad Dog Craft Beer to others:
Q4. Develop a time-series model to forecast Mad Dog Craft Beer production of pale ale in the next four fiscal quarters.
Q5. Produce a written report detailing ALL aspects of your analysis. Your report should be as detailed as possible and should describe ALL key outputs of your analysis.
SAVE TOP GRADE USING CASE STUDY - MAD DOG CRAFT BEER ASSIGNMENT HELP SERVICE OF EXPERTSMINDS.COM
Solution:
I have made report that contains various predicting models and analysis of the data. This report contains insights into the data as per the requirements. Each requirement is clearly pictured with explanation with the help of charts and tables .My findings will help in predicting the order quantity and recommendation variable of the Mad dog craft beer.
Introduction
Mad Dog Craft beer is an Australian brewery company with its operations in Melbourne and near regions like Victoria in brewing ale. It has limited experience in brewing but inspite of having limited experience it has seen increase in sales and production from last few years. Mad Dog Craft Beer sells beer to two segments of market. One is Pubs, Bars and Restaurants and other one is bottleshops. Beer is sold to these segments either directly or via sale representative. Mad Dog craft beer is concerned with forecasting the future demand and supply of their product. So, they have conducted a large survey to understand the customer buying behaviour. Therefore, the aim of this report is to analyze Mad dog craft beer's customers buying behavior and provide predictive models and insights for the provided data. The Mad dog survey has various variables such as
|
Loyalty
|
|
Cust_Type
|
|
Region
|
|
Dist_Channel
|
|
Quality
|
|
SM_Presence
|
|
Advert
|
|
Brand_Image
|
|
Comp_Pricing
|
|
Order_Fulfillment
|
|
Flex_Price
|
|
Shipping_Speed
|
|
Shipping_Cost
|
|
Order_Qty
|
|
Recommend
|
|
Year
|
|
Quarter
|
|
Ale_Product
|
Some of the variables are independent of the other variables.
The provided database consists of 200 observations. There are three segments of information in this database. The first group of information comes from Mad Dog Craft Beer's data warehouse and includes information about the customer such loyalty in years, type, region, and distribution channel. The second cluster of information relates to the customers' perceptions of Mad Dog Craft Beer on nine attributes. Mad Dog Craft Beer's customers were asked to rate the company on basis of a set of nine attributes using a 1 - 10 scale. The third cluster of information relates to order quantity and relationships in business(e.g., number of bottles bought from Mad Dog Craft Beer; and the probability of recommending Mad Dog Craft Beer to others).
The main features of this report include:
• What potential factors influence the order quantity of Mad dog Craft beer
• How many people suggest Mad dog craft beer to their concerned ones.
• A model for predicting order quantity of the mad dog craft beer
• Forecasting the production of beer in 2019 and 2020
Assumption
• The tools used in the analysis of data are Microsoft Excel and Add-in in excel real statistics.
• While making the model, only the statistical significance is considered, and p-value should be greater than 0.05
Analysis
DONT MISS YOUR CHANCE TO EXCEL IN CASE STUDY - MAD DOG CRAFT BEER ASSIGNMENT! HIRE TUTOR OF EXPERTSMINDS.COM FOR PERFECTLY WRITTEN CASE STUDY - MAD DOG CRAFT BEER ASSIGNMENT SOLUTIONS!
Task 1: Summary statistics of order Quantity and Recommend variables
1.1 Order Quantity
To provide overall picture of the order quantity and recommendation variables we have been provided with set of 200 random observations of Mad dog Craft Beer. We noticed that the mean of the order quantity is 7.7 thousand of bottles and the maximum value is 9.9 thousand. However, this statistics can differ with standard deviation of 0.89 thousand in and around the minimum and maximum. We can also observe from the graph that order quantity keep on increasing to a certain point. There are no outliers in the Order quantity. Order quantity has always remained less than 10000.
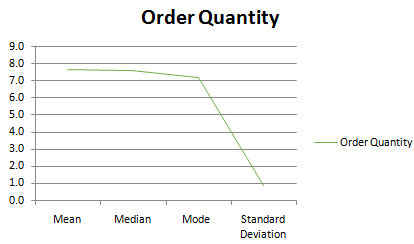
Fig 1: Chart of Order Quantity
|
Column1
|
Column2
|
|
Summary
|
|
|
|
Mean
|
7.665
|
|
Standard Error
|
0.063161077
|
|
Median
|
7.6
|
|
Mode
|
7.2
|
|
Standard Deviation
|
0.893232513
|
|
Sample Variance
|
0.797864322
|
|
Kurtosis
|
0.584037705
|
|
Skewness
|
-0.206346633
|
|
Range
|
5.6
|
|
Minimum
|
4.3
|
|
Maximum
|
9.9
|
|
Sum
|
1533
|
|
Std Data
|
200
|
Table 1:Summary Statastics of Order Quantity
1.2 Recommendation
The Recommend variable suggests whether customers will suggest Mad Dog Craft Beer to others or not. From analysing of 200 random customer samples,5it has been observed that 50% of the customers recommended Mad dog craft beer to the other customers and 50% of the customers did not recommend Mad dog craft beer to other customers. This is clearly shown in the pie chart which we obtained by plotting recommendation of various customers.
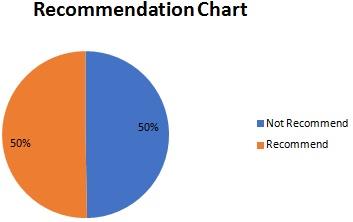
Fig 2:-Recommendation Chart
ARE YOU LOOKING FOR RELIABLE CASE STUDY - MAD DOG CRAFT BEER ASSIGNMENT HELP SERVICES? EXPERTSMINDS.COM IS RIGHT CHOICE AS YOUR STUDY PARTNER!
Task 2: Potential factors influencing Order Quantity
2.1 Identify possible factors
Order Quantity is an independent variable. Leaving recommend variable aside, multiple regression is performed with all the variables provided. With the help of multiple regression we get the coefficients of for the regression equation. After this, a scatter plot is plotted with dependent and independent variables to obtain a relationship between them.
Scatter Diagram:
Scatter diagram is a diagram which shows relationship between dependent and independent variables. Scatter plot is plotted between all the 14 variables. From the plotted scatter plots we can observe that the variables, loyalty and shipping cost have a linear relationship with order quantity whereas the other variables have a non-linear relationship with order quantity.
Correlation:
Correlation formula is used to identify a correlation coefficient between the dependent and independent variables .To get more clear picture of the dependent variable we have found correlation coefficient of all the variables. We have correlation coefficient of every variable with every other variable. From observing the correlation coefficient of all the variables, we have observed that order quantity is mainly influenced by the shipping cost. The variables which have correlation coefficient more than 0.5 have strong degree of relationship. Independent variables with the value correlation coefficient>0.5 have a strong relationship with each other and therefore we have chosen the variable shipping cost to predict the variable order quantity and eliminated all other variables as they have low correlation coefficient.
2.2 Model Building
In the process of model building, we have identified only one variable that is shipping cost to make the regression equation as all other variables have low correlation coefficient. The Adjusted r-square value indicates the usuage of variables which are not required and is found to be 96% which is almost equal to the r-square value. The standard error is found to be 1.83.The significance value indicates whether the model is significant to predict values or not .The r-squared value suggests the variation in order quantity and 96% of the variations in order quantity is explained by the variations in the dependent variables.
The final regression equation is as follows:
Order Quantity = 1.37 *Shipping cost
This equation can be interpreted as:
• For every unit increase in the shipping cost, the order quantity will increase by 1.37.
2.3 Interaction Effect
Here we are studying the interaction effect between order quantity, Brand and Quality. The quality is taken to be the independent variable while the shop open and brand image is a moderator. We define the interaction variable to be the product of quality and brand image variable.
A regression model is run in which the p-value for all variables is observed to be more than 0.05 indicating that the model is insignificant. The visualization shows that the perception of the product quality does not affect the order quantity and from the interaction table we can infer that the assumption made by Todd of the brand image and order quantity is weaker for low quality product perception. There is no interaction between brand image and quality perception of product.
SAVE YOUR HIGHER GRADE WITH ACQUIRING CASE STUDY - MAD DOG CRAFT BEER ASSIGNMENT HELP & QUALITY HOMEWORK WRITING SERVICES OF EXPERTSMINDS.COM
Task 3: Predicting the likelihood of recommending Mad dog Craft beer to others
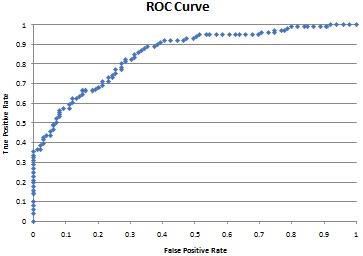
The objective is to predict likelihood of recommending Mad dog craft beer to other customers on basis of distribution channel, quality , brand image and shipping speed. On analyzing classification table, we can observe that 101 customers has recommended Mad dog craft beer to others while 99 customers has not recommended Mad dog craft beer to others The overall hit ratio is 77% suggesting that 76% of the classifications are done correctly. 103 observations have been correctly classified and 97 observations have been wrongly classified.
|
Dist_Channel
|
Quality
|
Brand_Image
|
Shipping_Speed
|
|
1
|
8.5
|
6.0
|
3.7
|
|
0
|
8.2
|
3.1
|
4.9
|
|
1
|
9.2
|
5.8
|
4.5
|
|
0
|
6.4
|
4.5
|
3.0
|
|
1
|
9.0
|
4.5
|
3.5
|
|
0
|
6.5
|
3.7
|
3.3
|
|
0
|
6.9
|
5.4
|
2.0
|
|
0
|
6.2
|
5.1
|
3.7
|
|
0
|
5.8
|
5.8
|
4.6
|
|
0
|
6.4
|
5.7
|
4.4
|
|
1
|
8.7
|
4.6
|
4.0
|
|
0
|
6.1
|
6.4
|
3.2
|
|
1
|
9.5
|
6.6
|
4.4
|
|
1
|
9.2
|
4.8
|
4.2
|
|
1
|
6.3
|
5.9
|
5.2
|
|
0
|
8.7
|
3.8
|
4.5
|
|
1
|
5.7
|
5.1
|
4.5
|
|
0
|
5.9
|
5.5
|
4.8
|
|
0
|
5.6
|
5.6
|
4.5
|
|
0
|
9.1
|
7.1
|
4.4
|
|
0
|
5.2
|
5.0
|
3.3
|
|
1
|
9.6
|
7.8
|
4.3
|
|
1
|
8.6
|
4.7
|
4.0
|
|
1
|
9.3
|
4.5
|
4.5
|
|
0
|
6.0
|
5.3
|
4.0
|
|
0
|
6.4
|
5.3
|
3.9
|
|
0
|
8.5
|
3.7
|
4.4
|
|
0
|
7.0
|
4.2
|
3.7
|
|
0
|
8.5
|
3.7
|
4.4
|
|
0
|
7.6
|
4.6
|
3.5
|
|
1
|
6.9
|
4.7
|
3.3
|
|
0
|
8.1
|
3.8
|
3.0
|
|
0
|
6.7
|
4.9
|
3.4
|
|
0
|
8.0
|
4.7
|
4.2
|
|
0
|
6.7
|
6.8
|
3.5
|
|
0
|
8.7
|
2.9
|
2.5
|
|
1
|
9.0
|
4.5
|
3.5
|
|
1
|
9.6
|
5.5
|
4.9
|
|
0
|
8.2
|
5.0
|
4.5
|
|
0
|
6.1
|
6.4
|
3.2
|
|
0
|
8.3
|
5.2
|
3.9
|
|
1
|
9.4
|
4.9
|
4.1
|
|
1
|
9.3
|
6.3
|
4.3
|
|
1
|
5.1
|
7.8
|
4.5
|
|
0
|
8.0
|
3.0
|
4.7
|
|
0
|
5.9
|
5.5
|
4.8
|
|
1
|
10.0
|
4.5
|
3.5
|
|
0
|
5.7
|
6.0
|
5.2
|
|
1
|
9.9
|
6.7
|
3.9
|
|
1
|
7.9
|
5.8
|
4.3
|
|
0
|
6.7
|
4.8
|
2.8
|
|
0
|
8.2
|
3.1
|
4.9
|
|
1
|
9.4
|
4.6
|
4.6
|
|
1
|
6.9
|
4.7
|
3.3
|
|
0
|
8.0
|
4.7
|
4.2
|
|
0
|
9.3
|
5.5
|
3.4
|
|
1
|
7.4
|
6.9
|
5.5
|
|
0
|
7.6
|
5.4
|
4.0
|
|
0
|
10.0
|
4.5
|
3.5
|
|
0
|
9.9
|
3.5
|
4.0
|
|
0
|
8.7
|
3.8
|
4.5
|
|
1
|
8.4
|
5.9
|
3.6
|
|
1
|
8.8
|
4.8
|
2.9
|
|
0
|
7.7
|
3.4
|
2.6
|
|
0
|
6.6
|
4.8
|
2.8
|
|
0
|
5.7
|
6.0
|
5.2
|
|
0
|
5.7
|
5.1
|
4.5
|
|
1
|
5.5
|
4.9
|
4.3
|
|
0
|
7.5
|
4.5
|
3.4
|
|
0
|
6.4
|
5.3
|
3.9
|
|
0
|
9.1
|
7.1
|
4.4
|
|
1
|
6.7
|
4.5
|
3.1
|
|
0
|
6.5
|
6.0
|
4.6
|
|
1
|
9.9
|
6.7
|
3.9
|
|
1
|
8.5
|
6.0
|
3.7
|
|
0
|
9.9
|
4.8
|
3.8
|
|
1
|
7.6
|
5.0
|
3.9
|
|
1
|
9.4
|
4.9
|
4.1
|
|
1
|
9.3
|
5.9
|
4.6
|
|
0
|
7.1
|
5.9
|
2.7
|
|
0
|
9.9
|
4.8
|
3.8
|
|
0
|
8.7
|
4.6
|
4.0
|
|
1
|
8.6
|
4.0
|
3.0
|
|
0
|
6.4
|
5.0
|
1.6
|
|
1
|
7.7
|
4.3
|
4.3
|
|
0
|
7.5
|
4.5
|
3.4
|
|
0
|
5.0
|
4.9
|
3.1
|
|
1
|
7.7
|
4.3
|
4.3
|
|
1
|
9.1
|
4.6
|
3.9
|
|
1
|
5.5
|
8.2
|
4.9
|
|
0
|
9.1
|
5.4
|
3.3
|
|
0
|
7.1
|
4.5
|
2.4
|
|
1
|
9.2
|
4.8
|
4.2
|
|
1
|
9.3
|
5.9
|
4.6
|
|
0
|
9.3
|
5.5
|
3.4
|
|
1
|
8.6
|
5.7
|
3.6
|
|
1
|
7.4
|
4.8
|
3.7
|
|
1
|
8.7
|
2.9
|
2.5
|
|
1
|
7.8
|
7.1
|
3.9
|
|
0
|
7.9
|
4.8
|
3.5
|
|
0
|
7.6
|
4.6
|
3.5
|
|
1
|
9.2
|
6.2
|
4.2
|
|
1
|
7.7
|
7.0
|
3.7
|
|
1
|
9.5
|
6.6
|
4.4
|
|
0
|
6.5
|
6.0
|
4.6
|
|
0
|
8.3
|
5.2
|
3.9
|
|
1
|
9.6
|
5.5
|
4.9
|
|
0
|
5.9
|
6.2
|
5.4
|
|
1
|
8.7
|
4.8
|
4.2
|
|
0
|
6.7
|
4.5
|
3.1
|
|
1
|
9.7
|
6.1
|
4.1
|
|
1
|
8.8
|
4.5
|
3.9
|
|
0
|
8.2
|
5.0
|
4.5
|
|
1
|
8.9
|
6.9
|
4.2
|
|
1
|
8.4
|
5.9
|
3.6
|
|
1
|
7.7
|
7.0
|
3.7
|
|
1
|
9.2
|
6.2
|
4.2
|
|
0
|
7.3
|
6.1
|
2.9
|
|
1
|
9.0
|
5.0
|
3.1
|
|
0
|
8.1
|
3.8
|
3.0
|
|
1
|
7.4
|
6.9
|
5.5
|
|
0
|
7.9
|
4.8
|
3.5
|
|
0
|
7.7
|
3.4
|
2.6
|
|
1
|
9.4
|
4.6
|
4.6
|
|
0
|
7.2
|
4.7
|
2.5
|
|
1
|
8.3
|
6.1
|
3.1
|
|
0
|
7.9
|
5.8
|
4.3
|
|
0
|
7.3
|
6.1
|
2.9
|
|
1
|
9.6
|
7.8
|
4.3
|
|
0
|
8.3
|
2.5
|
2.1
|
|
1
|
8.6
|
4.7
|
4.0
|
|
0
|
8.0
|
3.0
|
4.7
|
|
0
|
6.4
|
5.0
|
1.6
|
|
0
|
6.6
|
6.6
|
3.3
|
|
1
|
7.6
|
4.2
|
4.2
|
|
1
|
9.4
|
4.7
|
4.4
|
|
0
|
8.3
|
2.5
|
2.1
|
|
1
|
7.8
|
7.1
|
3.9
|
|
0
|
7.1
|
4.5
|
2.4
|
|
1
|
7.6
|
5.0
|
3.9
|
|
0
|
5.6
|
5.6
|
4.5
|
|
0
|
9.9
|
3.5
|
4.0
|
|
1
|
9.2
|
5.8
|
4.5
|
|
0
|
9.1
|
4.5
|
4.2
|
|
0
|
9.9
|
4.5
|
3.5
|
|
1
|
9.9
|
4.5
|
3.5
|
|
0
|
6.6
|
6.6
|
3.3
|
|
0
|
9.1
|
5.4
|
3.3
|
|
1
|
5.1
|
7.8
|
4.5
|
|
0
|
6.0
|
5.3
|
4.0
|
|
0
|
8.9
|
6.9
|
4.2
|
|
0
|
6.2
|
5.1
|
3.7
|
|
0
|
7.2
|
4.7
|
2.5
|
|
1
|
8.8
|
4.5
|
3.9
|
|
0
|
6.3
|
6.6
|
3.4
|
|
0
|
9.7
|
4.7
|
3.6
|
|
0
|
5.0
|
4.9
|
3.1
|
|
1
|
7.4
|
4.8
|
3.7
|
|
1
|
5.5
|
4.9
|
4.3
|
|
1
|
9.1
|
4.6
|
3.9
|
|
0
|
6.7
|
4.9
|
3.4
|
|
1
|
6.3
|
5.9
|
5.2
|
|
1
|
8.3
|
6.1
|
3.1
|
|
1
|
8.2
|
6.0
|
3.0
|
|
1
|
8.2
|
6.0
|
3.0
|
|
1
|
9.0
|
5.0
|
3.1
|
|
0
|
7.1
|
5.9
|
2.7
|
|
0
|
6.9
|
5.4
|
2.0
|
|
1
|
8.6
|
4.0
|
3.0
|
|
0
|
6.7
|
6.8
|
3.5
|
|
0
|
7.0
|
4.2
|
3.7
|
|
0
|
9.7
|
3.3
|
3.8
|
|
1
|
9.9
|
6.7
|
3.9
|
|
1
|
8.6
|
5.7
|
3.6
|
|
0
|
6.3
|
6.6
|
3.4
|
|
1
|
9.9
|
6.7
|
3.9
|
|
1
|
9.3
|
4.5
|
4.5
|
|
1
|
9.7
|
6.1
|
4.1
|
|
0
|
9.7
|
3.3
|
3.8
|
|
1
|
9.6
|
7.8
|
4.3
|
|
1
|
7.6
|
4.2
|
4.2
|
|
0
|
9.4
|
4.7
|
4.4
|
|
1
|
9.6
|
7.8
|
4.3
|
|
1
|
9.3
|
6.3
|
4.3
|
|
0
|
9.7
|
4.7
|
3.6
|
|
1
|
9.1
|
4.5
|
4.2
|
|
0
|
6.5
|
3.7
|
3.3
|
|
0
|
6.6
|
4.8
|
2.8
|
|
0
|
5.8
|
5.8
|
4.6
|
|
1
|
8.7
|
4.8
|
4.2
|
|
1
|
8.8
|
4.8
|
2.9
|
|
0
|
6.4
|
5.7
|
4.4
|
|
0
|
6.7
|
4.8
|
2.8
|
|
0
|
5.2
|
5.0
|
3.3
|
|
0
|
6.4
|
4.5
|
3.0
|
|
0
|
7.6
|
5.4
|
4.0
|
|
0
|
5.9
|
6.2
|
5.4
|
|
1
|
9.7
|
6.1
|
4.2
|
|
1
|
5.5
|
8.2
|
4.9
|
|
1
|
9.7
|
6.1
|
4.2
|
|
|
|
|
|
|
|
|
|
|
|
Suc-Obs
|
Fail-Obs
|
|
|
78
|
25
|
103
|
|
23
|
74
|
97
|
|
101
|
99
|
200
|
|
|
|
|
0.772277
|
0.747475
|
0.76
|
|
|
|
|
0.5
|
|
|
|
|
|
|
Covariance Matrix
|
|
5.20039
|
0.134579
|
-0.27824
|
-0.28872
|
-0.39594
|
|
0.134579
|
0.141982
|
-0.01546
|
-0.01623
|
0.002263
|
|
-0.27824
|
-0.01546
|
0.023643
|
0.012479
|
0.008769
|
|
-0.28872
|
-0.01623
|
0.012479
|
0.038126
|
0.000362
|
|
-0.39594
|
0.002263
|
0.008769
|
0.000362
|
0.082845
|
For predicting the model, we are considering four variables that is quality, brand image , distribution channel and shipping speed.. A line graph is used to visualize the change in probabilities of recommending Mad dog craft beer related to the other factors. We notice that from the line chart that regardless of these factors there is high probability of recommending Mad dog craft beer to others.
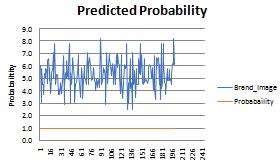
Fig 4: Probability of Recommending Mad Dog Craft Beer
DO YOU WANT TO EXCEL IN CASE STUDY - MAD DOG CRAFT BEER ASSIGNMENT? HIRE TRUSTED TUTORS FROM EXPERTSMINDS AND ACHIEVE SUCCESS!
Task 4: Time series Forecast
The objective of this task is to make a time series model to predict of production of Mad dog craft beer for the next four quarters. To find this forecast we have used the concept of moving average and the centered moving average. With the help of this we have found the trend and the forecast for the required quarters. To find the moving average we have found the average of the production of beer taking 4 at a time . then we have found the centered moving average of the production by averaging the moving average. After that we have found the average of each quarter then we found the Deseasonality of the production. After deaseasonality we found the regression equation and found the forecast for next for quarters.
|
Year
|
Quarter
|
Trend
|
Forecast
|
|
2009
|
Q3
|
0.988345
|
1658.812
|
|
Q4
|
0.984707
|
1252.758
|
|
2010
|
Q1
|
0.98107
|
1377.307
|
|
Q2
|
0.977432
|
1366.729
|
|
Q3
|
0.973794
|
1634.39
|
|
Q4
|
0.970157
|
1234.247
|
|
2011
|
Q1
|
0.966519
|
1356.879
|
|
Q2
|
0.962881
|
1346.383
|
|
Q3
|
0.959244
|
1609.969
|
|
Q4
|
0.955606
|
1215.735
|
|
2012
|
Q1
|
0.951968
|
1336.452
|
|
Q2
|
0.948331
|
1326.037
|
|
Q3
|
0.944693
|
1585.548
|
|
Q4
|
0.941055
|
1197.224
|
|
2013
|
Q1
|
0.937418
|
1316.024
|
|
Q2
|
0.93378
|
1305.691
|
|
Q3
|
0.930142
|
1561.126
|
|
Q4
|
0.926505
|
1178.712
|
|
2014
|
Q1
|
0.922867
|
1295.597
|
|
Q2
|
0.919229
|
1285.345
|
|
Q3
|
0.915592
|
1536.705
|
|
Q4
|
0.911954
|
1160.201
|
|
2015
|
Q1
|
0.908316
|
1275.17
|
|
Q2
|
0.904679
|
1264.999
|
|
Q3
|
0.901041
|
1512.283
|
|
Q4
|
0.897403
|
1141.689
|
|
2016
|
Q1
|
0.893766
|
1254.742
|
|
Q2
|
0.890128
|
1244.653
|
|
Q3
|
0.88649
|
1487.862
|
|
Q4
|
0.882853
|
1123.177
|
|
2017
|
Q1
|
0.879215
|
1234.315
|
|
Q2
|
0.875577
|
1224.307
|
|
Q3
|
0.87194
|
1463.44
|
|
Q4
|
0.868302
|
1104.666
|
|
2018
|
Q1
|
0.864664
|
1213.887
|
|
Q2
|
0.861027
|
1203.961
|
|
Q3
|
0.857389
|
1439.019
|
|
Q4
|
0.853751
|
1086.154
|
|
2019
|
Q1
|
0.850114
|
1193.46
|
|
Q2
|
0.846476
|
1183.615
|
|
Q3
|
0.842838
|
1414.598
|
|
Q4
|
0.839201
|
1067.643
|
|
2020
|
Q1
|
0.835563
|
1173.033
|
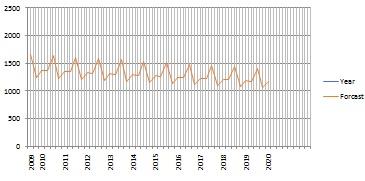
Fig 5: Production Forecast
Drawbacks
Since the sample size is 200, there are possibilities of variations in the process of modeling assuming the presence of any outliers. Although outlier is present, it has not been excluded to eliminate any inaccuracies in the prediction. Complying to that, the analysis is conducted on the provided statistical data without considering any business problems .Also most of the data is nominal so it is hard to predict the influencing potential factors affecting the model.
Conclusion
By Preparing various predictive models and analyzing the whole data we can conclude and suggest these results.
Mad dog craft beer needs to make the size of sample data more larger to avoid any sampling error.
Shipping cost mainly determine the order quantity. There is no interaction between the variables brand image and the perception of quality by the customer.
The likelihood of recommending Mad dog craft beer to other customers is high on basis of shipping speed, distribution channel , brand image and quality .
The forecast for Mad dog craft beer is low for the next 4 quarters as compared to the previous quarters.
NEVER LOSE YOUR CHANCE TO EXCEL IN CASE STUDY - MAD DOG CRAFT BEER ASSIGNMENT - HIRE BEST QUALITY TUTOR FOR ASSIGNMENT HELP!
Avail Deakin University Assignment Help service for its major courses and units, such as:
- MIS779 Decision Analytics in Practice Assignment Help
- MIS782 Value of Information Assignment Help
- MIS770 Foundation Skills in Data Analysis Assignment Help
- MIS772 Predictive Analytics Assignment Help
- MIS780 Advanced Artificial Intelligence for Business Assignment Help
- MIS784 Marketing Analytics Assignment Help
- MIS781 Business Intelligence Assignment Help
- MIS775 Decision Modelling for Business Analytics Assignment Help