ARE YOU LOOKING FOR RELIABLE INTRODUCTION TO FOOD SCIENCE ASSIGNMENT HELP SERVICES? EXPERTSMINDS.COM IS RIGHT CHOICE AS YOUR STUDY PARTNER!
Introduction to Food Science Assignment
Laboratory report on Post-harvest Physiology of Fruit and Vegetables: Moisture Loss.
Aim of the experiment was to compare moisture loss between fresh and deteriorated fruits and vegetables
Work on fluid content and importance of fruits and vegetables In introduction
Solution:
To study how the humidity, surface coating and temperature affect the moisture loss by fruits and vegetables.
DO YOU WANT TO EXCEL IN INTRODUCTION TO FOOD SCIENCE ASSIGNMENT? HIRE TRUSTED TUTORS FROM EXPERTSMINDS AND ACHIEVE SUCCESS!
Abstract:
Background: The fruits and vegetable are prone to damage during the storage conditions. The current study aims at studying the effect of various factors such as temperature both colder and room temperature, amount of humidity available in the air and the reduction in the water loss due to the application of various surface coating.
Methods: The fresh produce is harvested and immediately weighed on the day zero through to day ten. They are subjected to different treatment a total of three modules i.e. temperatures such as are 40 C and 200C, treated with wax, wrapped in tissue, punctured and washed in detergent.
Results: The fruits and vegetables when exposed to room temperature of 200C lost the moisture from the surface. Colder temperature of 40 C and a relatively higher humidity preserved the water content in all the produce. The oranges were used in testing the Surface coating with wax recorded the least amount of moisture loss 6% in comparison to all the other treatments, such as wrapping in tissue and puncturing the fruits.
Discussion : Fruits and vegetables showed a significant difference in the values of moisture retention due to the difference in storage conditions such as low temperature and surface coating owing to the protection of the dehydration of the cuticle.
Introduction:
Fruits and vegetables are the primary source of nutrient for a majority of the population. They are composed of porous tissues on their surface for efficient gaseous exchange during the growth of embryo. This property exposes them to loss of water i.e. dehydration through transpiration and collapseof their tissues leading to fruit softening (1, 2). The structural integrity is a major concern in the management of the quality and thereby to prevent the wastage of the resources. The food and agriculture organization estimate that there is at least 35 % loss of the produce across the world due to the poor storage environment. Dehydration of fruits and vegetables can be brought about by diverse factors such as temperature at which they are stored, surface coating or coverage. The average amount of water loss varies between different varieties of produce.
Quality criteria of the fresh vegetable includes the texture, low toxins, pesticide content. Post-harvest diverse mechanisms are recommended and used on a regular basis to preserve the nutritional quality and one such major concern is to prevent desiccation. The storage temperature plays a pivotal role in retaining the moisture content (3).
Studies support the storage in colder temperature prevents the dehydration and the quality. In the current study the effect of the different temperature both at 40 C and 200 C is studied (4)
One of the most promising technique to prevent the moisture loss and extend the life span of fruits is the usage of surface coats. Preservation of the fruits is facilitated by the surface coating. Currently across the globe there are a number of chemicals used as preservative to extend the shelf life of the produce such as Aloe Vera and shellac (5). One of those kinds is the edible coating with waxy substance on the cuticle of the fruit. These coating acts similar to the cuticle which prevent the transfer of moisture from the fruit to the immediate environment(6). Edible coatings are composed of hydrophobic substances and are usually lipid-based. The waxy substance is known to prevent the gaseous exchange and regulate the environment which further prevents the physiological changes in the cells such as enzyme mediated oxidation(7).
However, the maximum impact of these coating is achieved when the fruits are stored under cold conditions. This method can be extended to the freshly cut fruits and their commercial application (8) One limitation of these application is the reduction in the overall quality due to the lack of absolutely edible copoint in these coatings (3, 9)
SAVE YOUR HIGHER GRADE WITH ACQUIRING INTRODUCTION TO FOOD SCIENCE ASSIGNMENT HELP & QUALITY HOMEWORK WRITING SERVICES OF EXPERTSMINDS.COM
Methods:
Moisture loss from produce: Moisture content from the initially intact fruits of oranges, cabbage leaves, small and large carrots and apples over a period of ten days was assessed. The external environment is maintained at 200 C. Fruits and vegetable of similar weight i.e at least 300gm and a minimum of 3 samples each are considered for the experiment. The weight loss is calculated for each fruit and vegetable across the ten days. Three reading are recorded each day, mean values for each day are calculated. Graph is plotted for the percentage of water loss over the period of ten days for all the fruits and vegetables.
Modification of surface coating:The fresh oranges were used with a minimum sample size of 5. The fruits were stored under regular room condition which acts as control, the test groups are wrapped in tissue, washed with a surface detergent, punctured and dipped in wax. The mean values are calculated and a graph is plotted with the average values for the water loss with the different treatment methods(10).
Effect of humidity and temperature: Two different storage temperatures are used and relatively moisture environment condition is prepared using a clear fresh bag to cover the fruits. The temperatures maintained for this experiment are 40 C and 200 C. Both cabbages and the carrots are used as samples. Three replicates are used to consider the treatment measurements(11).
In all the above experiments, the weight of the fruits and vegetables is performed since the day of the harvest i.e. day zero and until day ten. Weight loss is expressed as a percentage and is corelated to the water loss(12)
EXPERTSMINDS.COM ACCEPTS INSTANT AND SHORT DEADLINES ORDER FOR INTRODUCTION TO FOOD SCIENCE ASSIGNMENT - ORDER TODAY FOR EXCELLENCE!
Results:
Table 1: Weight loss and water loss in fruits and vegetable over time
The weight loss of the fresh produce (Cabbage, apples, oranges, small and large carrots) is recorded at 200 C. The three replicates are recorded every day with a gap of 2-hour duration. Measures of the weight loss are presented in the table 1. There was no significant difference in the water loss in oranges with an initial reading 976gm (SD = 99.0) to 881gm (SD = 90.0) However a large standard deviation was observed. Water loss is the highest in cabbage leaves with an initial harvest reading of 300gm (SD = 0.0) reduced to 85gm (SD=19.0), The apples weighed initially 941gm (SD = 11.0) , on the tenth day 929gm (SD = 15.0). Weight loss observed in the small carrots 124gm to (SD = 42.12), Large carrots showed a significant reduction in the weight from an initial reading of 265gm (SD = 40.14) to 45 gm (SD = 7.0). A large variation is observed in the standard deviation values of the small and large carrots.
|
QTY
|
|
Day 0
|
Day 1
|
Day 2
|
Day 3
|
Day 4
|
Day 5
|
Day 6
|
Day 7
|
Day 8
|
Day 9
|
Day 10
|
Day 11
|
|
Turgid Cabbage Leaves (g)
|
300g
|
Mean
|
300.00
|
250.33
|
214.67
|
195.67
|
173.33
|
156.67
|
146.67
|
136.00
|
118.67
|
105.33
|
97.00
|
85.33
|
|
SD
|
|
SD
|
0.00
|
19.40
|
12.34
|
8.74
|
7.37
|
10.97
|
14.47
|
16.82
|
19.63
|
16.86
|
18.36
|
19.35
|
|
Oranges (g)
|
5
|
Mean
|
976.00
|
964.33
|
952.67
|
946.00
|
934.33
|
926.00
|
919.33
|
913.33
|
904.67
|
897.33
|
890.33
|
881.67
|
|
SD
|
|
SD
|
99.95
|
96.13
|
97.17
|
96.50
|
96.84
|
96.60
|
94.30
|
94.30
|
92.64
|
91.66
|
91.77
|
90.09
|
|
Apples (g)
|
3
|
Mean
|
941.67
|
940.00
|
939.33
|
938.33
|
936.33
|
934.67
|
934.33
|
934.00
|
933.00
|
932.00
|
930.00
|
929.33
|
|
SD
|
|
SD
|
11.59
|
11.27
|
13.58
|
12.74
|
13.58
|
13.28
|
13.58
|
14.73
|
12.17
|
13.86
|
13.00
|
15.31
|
|
Small Carrots (g)
|
3
|
Mean
|
124.67
|
101.00
|
79.33
|
68.33
|
53.33
|
41.33
|
34.33
|
28.67
|
23.33
|
20.00
|
18.00
|
20.33
|
|
SD
|
|
SD
|
42.12
|
30.45
|
22.05
|
19.14
|
16.50
|
13.32
|
13.32
|
11.93
|
8.33
|
7.21
|
7.21
|
10.02
|
|
Large Carrots (g)
|
5
|
Mean
|
265.00
|
227.00
|
188.67
|
168.67
|
139.33
|
118.00
|
102.33
|
88.00
|
72.67
|
63.33
|
57.33
|
45.00
|
|
SD
|
|
SD
|
40.15
|
32.60
|
21.73
|
20.11
|
11.93
|
15.72
|
16.92
|
16.00
|
15.04
|
14.19
|
13.58
|
7.00
|
|
|
|
|
|
|
|
|
|
|
|
|
|
|
|
|
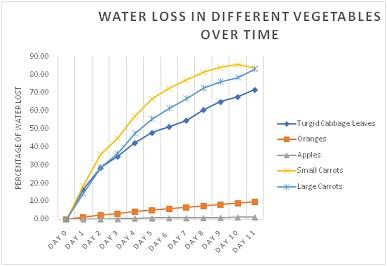
Figure 1: Percentage of water loss in fruits and vegetables over time
Measures of water loss of fresh oranges was calculated through the weight loss. Control group showed a significant weight loss over a period of ten days from an initial reading of 195.2gm (SD =19.81) to the final value of 176.33gm (SD =18.91) and water loss of 9.57%. The first test group used a tissue t wrap around the fruit. No significant change in the weight loss is observed compared to the control group with an initial reading of 195.33gm (SD =10.65) and a last reading of 176.73gm (SD =11.65) with a 9.51% of water loss. Punctured group showed maximum weight loss in ten days 199.87gm (SD =15.91) to 173.60gm (SD =21.69) with a 12.7% water loss, detergent washed fruits showed similar results as that of punctured fruits 179.27gm (SD =11.98) to 156.40gm (SD =14.54) and a 12.2% water loss. A significantly least amount of 6% water loss is recorded in fruits coated with wax with a corresponding weight loss from an initial 189.67gm (SD =19.31) to 177.60gm (SD=18.26).
|
|
Day 0
|
Day 1
|
Day 2
|
Day 3
|
Day 4
|
Day 5
|
Day 6
|
Day 7
|
Day 8
|
Day 9
|
Day 10
|
Day 11
|
|
Control
|
Mean
|
195.20
|
192.87
|
190.53
|
189.20
|
186.87
|
185.20
|
183.87
|
182.67
|
180.93
|
179.47
|
178.07
|
176.33
|
|
SD
|
19.81
|
19.29
|
19.38
|
19.26
|
19.39
|
19.40
|
19.14
|
19.18
|
19.07
|
18.96
|
18.85
|
18.91
|
|
Wrapped in Tissue
|
Mean
|
195.33
|
193.20
|
191.20
|
189.93
|
187.73
|
186.07
|
184.80
|
183.33
|
181.33
|
179.93
|
178.67
|
176.73
|
|
SD
|
10.65
|
10.63
|
10.82
|
10.51
|
10.80
|
10.89
|
10.88
|
11.27
|
11.09
|
11.54
|
11.68
|
11.65
|
|
Punctured
|
Mean
|
199.87
|
197.93
|
195.27
|
193.33
|
190.93
|
188.67
|
186.80
|
184.60
|
181.33
|
178.60
|
176.73
|
173.60
|
|
SD
|
15.91
|
16.16
|
16.63
|
16.33
|
16.68
|
16.43
|
16.47
|
16.95
|
18.25
|
19.72
|
20.49
|
21.69
|
|
Detergent Washed
|
Mean
|
179.27
|
176.20
|
173.40
|
171.67
|
168.87
|
166.87
|
165.27
|
163.87
|
161.47
|
159.80
|
157.73
|
156.40
|
|
SD
|
11.98
|
12.51
|
12.78
|
12.88
|
13.22
|
13.43
|
13.76
|
13.93
|
13.85
|
14.37
|
14.26
|
14.54
|
|
Dipped in Wax
|
Mean
|
189.67
|
187.93
|
186.40
|
185.27
|
183.87
|
182.67
|
181.80
|
181.07
|
179.93
|
179.33
|
178.40
|
177.60
|
|
SD
|
19.31
|
19.48
|
19.15
|
18.76
|
18.84
|
18.64
|
18.44
|
18.77
|
18.32
|
18.37
|
18.21
|
18.26
|
Table 2: Percentage water loss in vegetables and fruits with different treatments
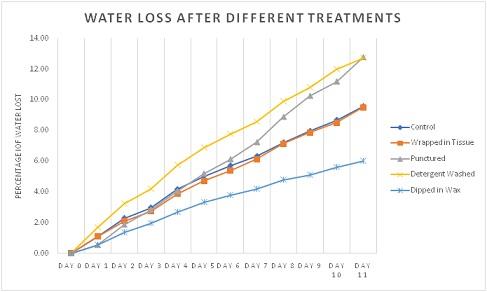
Figure 2: Percentage of water loss in vegetables and fruits with different treatment
Effect of humidity and temperature: Results obtained from the temperature and humidity studies are as follows.
Cabbages maintained at 40 C showed an initial reading of 100.00gm (SD =0.00) on day ten 63.67gm (SD =5.51) with a maximum water loss of 36%. Cabbage enclosed in a fresh bag at 40 C showed the least amount of difference in the weight 100.00gm (SD =0.00) with a least amount of 3.33% water loss. Cabbages at 20°C recorded the highest weight and water loss100.67gm (SD =1.15) with a final reading 15.00gm (SD =2.65) and a 85% water loss, Cabbages covered with fresh bags recorded 104.67gm (SD=8.08) and a final reading of 91.33gm (SD=4.51) and relatively lower water loss of 12% when compared to the ones stored out in the open.
Carrots maintained at 40 C showed an initial reading of 96.67gm (SD =5.77) on day ten 40.33gm (SD =5.51) with a least water loss of 58.28%. Carrots enclosed in a fresh bag at 40 C showed the least amount of difference in the weight 97.67gm (SD =5.69) to 96.33gm (SD =5.13) with a least amount of 1.37% water loss. Carrots at 20°C recorded the highest weight and water loss 96.33gm (SD =6.35) with a final reading 12.67gm (SD =2.08) and a 86.85% water loss, Carrots covered with fresh bags 20°C recorded 105.00gm (SD=1.0) and a final reading of 97.0gm (SD=3.0) and relatively lower water loss of 7.67% when compared to the ones stored out in the open
|
|
Day 0
|
Day 1
|
Day 2
|
Day 3
|
Day 4
|
Day 5
|
Day 6
|
Day 7
|
Day 8
|
Day 9
|
Day 10
|
Day 11
|
|
Cabbage 4°C
|
Mean
|
100.00
|
92.67
|
87.33
|
83.67
|
79.67
|
77.33
|
75.00
|
72.33
|
69.33
|
66.67
|
65.33
|
63.67
|
|
SD
|
0.00
|
2.08
|
3.21
|
2.08
|
3.79
|
4.93
|
4.36
|
4.16
|
4.16
|
4.51
|
6.03
|
5.51
|
|
Cabbage + Clearly Fresh Bag 4°C
|
Mean
|
100.00
|
99.00
|
98.33
|
98.00
|
98.00
|
98.00
|
97.67
|
97.33
|
96.67
|
97.33
|
96.67
|
96.67
|
|
SD
|
0.00
|
1.00
|
1.15
|
1.00
|
1.00
|
1.00
|
0.58
|
0.58
|
0.58
|
1.15
|
0.58
|
0.58
|
|
Cabbage 20°C
|
Mean
|
100.67
|
80.67
|
66.00
|
58.00
|
48.00
|
41.67
|
37.00
|
32.33
|
26.00
|
22.00
|
19.67
|
15.00
|
|
SD
|
1.15
|
2.89
|
4.36
|
5.20
|
4.36
|
4.73
|
4.36
|
4.04
|
3.61
|
3.61
|
3.06
|
2.65
|
|
Cabbage + Clearly Fresh Bag 20°C
|
Mean
|
104.67
|
99.33
|
98.33
|
98.00
|
97.00
|
95.67
|
94.67
|
94.00
|
92.33
|
92.00
|
91.00
|
91.33
|
|
SD
|
8.08
|
0.58
|
1.15
|
1.00
|
1.00
|
0.58
|
1.53
|
1.73
|
1.53
|
1.73
|
1.73
|
4.51
|
|
Carrots 4°C
|
Mean
|
96.67
|
90.00
|
78.33
|
74.00
|
67.67
|
62.33
|
58.33
|
54.67
|
49.67
|
47.00
|
44.33
|
40.33
|
|
SD
|
5.77
|
6.08
|
6.81
|
6.08
|
6.11
|
6.43
|
5.69
|
5.77
|
6.11
|
6.56
|
6.51
|
5.51
|
|
Carrots + Clearly Fresh Bag 4°C
|
Mean
|
97.67
|
97.33
|
97.33
|
97.00
|
97.00
|
97.00
|
97.00
|
97.00
|
96.00
|
96.33
|
96.33
|
96.33
|
|
SD
|
5.69
|
5.13
|
5.13
|
5.29
|
5.29
|
5.29
|
5.29
|
5.29
|
5.29
|
5.13
|
5.86
|
5.13
|
|
Carrots 20°C
|
Mean
|
96.33
|
77.33
|
60.33
|
50.00
|
39.00
|
31.33
|
26.00
|
21.33
|
18.33
|
15.67
|
14.67
|
12.67
|
|
SD
|
6.35
|
13.20
|
16.80
|
16.52
|
14.11
|
12.06
|
8.54
|
6.51
|
6.11
|
4.04
|
3.06
|
2.08
|
|
Carrots + Clearly Fresh Bag 20°C
|
Mean
|
105.00
|
103.67
|
103.33
|
102.67
|
101.67
|
101.00
|
100.67
|
100.33
|
99.33
|
99.00
|
98.67
|
97.00
|
|
SD
|
1.00
|
0.58
|
0.58
|
1.15
|
1.15
|
1.73
|
1.15
|
1.53
|
2.08
|
3.00
|
2.52
|
3.00
|
|
|
|
|
|
|
|
|
|
|
|
|
|
|
Table 3: Percentage of water loss under different storage conditions at 40 C and 20 0 C
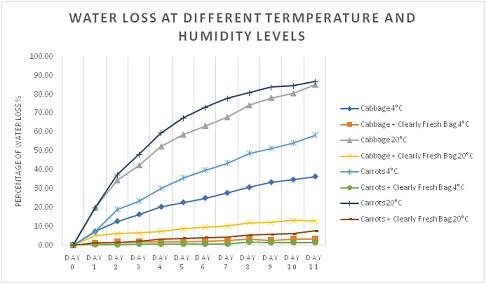
Figure 3: Percentage of water loss under different storage conditions at 40 C and 20 0 C
Discussion:
As the results showed in Figure.1, the weight loss of produce over the duration of ten days at 20 0 C showed a dramatic decrease in the weight and water content. This phenomenon showed a relatively similar pattern however, the cabbage and carrots were highly affected indicating the surface area and porous nature of these vegetables. Carrots are best suited to cooler climates (13) On the other hand the oranges and apples showed a relatively less water loss attributed to the presence of a protective cuticle around these fruits(1).
Storage of fruits and vegetable was significantly affected by the protective covering around them. Figure 2 shows that the fruits dipped in wax showed the least amount of 6% water loss and the highest is recorded in the punctured and detergent washed around 12%. Puncturing the fruits damages the cuticle and exposes the internal structures to environment. This leads to the rapid water loss. Detergents break the surface tension of the water content on the surface of the fruit and result in the loss of water which further forces the osmotic movement of water from the internal structures to the surface. On the other hand the waxy coating which is hydrophobic forms a barrier between the fruit and the environment(10).
Humidity has a positive effect on the prevention of water loss in fruits and vegetable which is observed in the Figure 3. This impact is greatest when the temperature is maintained at 40 C. The minimum water loss of cabbages and carrots at 40 C covered in fresh bad that maintained surrounding humid conditions recorded the least water losses of 3.33% and 1.37% respectively(14).
Conclusion:
In conclusion, the data provided here unequivocally suggests changes in the levels of dehydration based on the modification in the external environment of the fruits and vegetable during their storage. The produce naturally loses water content over a period of time. Storing them at colder temperatures i.e. at 40 C is ideal to improve the shelf life. Surface coats provide the protection against desiccation. Combining the effect of wax-coating and the colder temperature is an ideal method to elevate the retention of the nutritional quality of the produce (9).
NEVER LOSE YOUR CHANCE TO EXCEL IN INTRODUCTION TO FOOD SCIENCE ASSIGNMENT - HIRE BEST QUALITY TUTOR FOR ASSIGNMENT HELP!