MN506 System Management, Melbourne Institute of Technology, Australia
Assessment - Server Availability Monitoring and Metrics.
The purpose of the assignment is to compare free (open source) server monitoring tools based on the basic metrics of checking availability. Students will be able to complete the following ULOs:
1. Analyse and compare various server management systems
2. Compare emerging tools and techniques for system management
WORK TOGETHER WITH EXPERTSMIND’S TUTOR TO ACHIEVE SUCCESS IN MN506 SERVER AVAILABILITY MONITORING AND METRICS ASSIGNMENT!
Assignment Description
Compare server availability monitoring tools Including (1) Nagios Core, (2) Ganglia, (3) CollectD, (4) Spiceworks, (5) Cacti, (6) Zabbix, (7) Icinga, (8) OpenNMS, and (9) WhatsUp Gold, in terms of the metrics given in the following. The students are required to submit a report, which includes:
Question 1. Comparison of the above server availability monitoring tools to check their performance in terms of:
a) Disk usage
b) CPU monitoring
c) Process Monitoring
d) Bandwidth Monitoring
e) Resource Measuring
f) Overall availability
Answer :
Introduction
Server monitoring is a process of analyzing and evaluating a server for different parameters such as availability, operations, security, performance, and the other operation associated processes. It is performed by the experts to confirm that the server is performing as required and to reduce the problems which might hamper the performance of the server. It can be performed manually or automatically by the help of server monitoring softwares. These softwares are used to identify the problems of the server, which helps the server administrator to further enhance the server quality and performance by analyzing the data. In this study, different open source server monitoring tools is compared on the basics metrics of checking availability .A thorough comparison of these tools would help us in identifying the best and reliable software available in the market.
NEVER LOSE YOUR CHANCE TO EXCEL IN MN506 SERVER AVAILABILITY MONITORING AND METRICS ASSIGNMENT – HIRE BEST QUALITY TUTOR FOR ASSIGNMENT HELP!
Comparison - In this report, different important server monitoring software have been discussed like Ganglia, Nagios Core, CollectD, Spiceworks, Cacti, Zabbix, Icinga, Open NMs and WhatsUp Gold in terms of
• Usage Of Disk
• Monitoring the Central Processing Unit
• Monitoring of Bandwidth
• Measuring of Resource
• Overall Availability
Disk Usage- Disk Usage of a server indicates the percentage or the portion of the computer storage which is currently in use [4]. It is measure in kilobytes, megabytes, gigabytes, and terabytes. 100 % disk usage of a server means that disk has occupied the maximum space available in the disk.
CPU Monitoring- It is defined as a process of monitoring the Central Process Unit’s overall performance. The monitoring of the system includes usage and frequency of CPU, Ram’s health, fan speed, system uptime, and various power supply issues.
Bandwidth Monitoring- It is a process of identifying or measuring the actual bandwidth available on a local system or server [5]. It displays real-time behaviour of the server and the speeds of uploads and downloads processing on the server. This functioning or the monitoring of the bandwidth enables the server administrator to prevent the network strain.
Resource Measuring- The monitoring process of the tools is not fixed as different tools use different techniques or process to monitor the system 2]. There are few methods and protocols that are widely used by most of the server monitoring tools to tackle the issues which might impact overall performance of the server.
Overall Availability- Ganglia, Nagios Core, CollectD, Spiceworks, and Cacti etc are the open source server availability monitoring tools which are easily available over the internet. The software is available for most of the operating system means they are cross-platform software.
|
Software
|
Usage of Disk
|
Monitoring of CPU
|
Monitoring of Bandwidth
|
Resource Measuring
|
Overall Availability
|
|
Ganglia
|
Moderate
|
Good
|
Good
|
Moderate
|
Fine
|
|
Nagios Core
|
Good
|
Good
|
Excellent
|
Moderate
|
Fine
|
|
CollectD
|
Limited
|
Limited
|
Moderate
|
Moderate
|
Developing
|
|
Spiceworks
|
Limited
|
Limited
|
Good
|
Moderate
|
Developing
|
|
Cacti
|
Developing
|
Developing
|
Average
|
Moderate
|
Moderate
|
|
Zabbix
|
Moderate
|
Moderate
|
Good
|
Moderate
|
Moderate
|
|
Icinga
|
Good
|
Good
|
Excellent
|
Moderate
|
Moderate
|
|
Open NMs
|
Moderate
|
Moderate
|
Good
|
Moderate
|
Moderate
|
|
WhatsUp Gold
|
Excellent
|
Excellent
|
Excellent
|
Moderate
|
Good
|
ARE YOU LOOKING FOR RELIABLE MN506 SERVER AVAILABILITY MONITORING AND METRICS ASSIGNMENT HELP SERVICES? EXPERTSMINDS.COM IS RIGHT CHOICE AS YOUR STUDY PARTNER!
Ganglia- It’s scalable software that is used to monitor the high performing computer software, network as well the clusters. Ganglia software is utilized in order to check the live as well as recorded statistic converting metrics like the use of network for several modes.
Nagios Core- Nagios Core is a server monitoring tool that simplifies the operation or the management of a server [2]. The staffs of the administrative body in an organization can chose the automatic configuration of this software. This is an open source tool or software that monitors servers, application, switch as well as services and warns the user whenever it is required.
CollectD- This is a Unix Daemon which acquires transfers as well as stores the data or the information related to the performance in computer and network apparatus. Such data that has been accumulated are further used in order to assist the administrators to keep a record the available assets, faults, or error that exist in the system.
Spiceworks- It is a simple but powerful online application that is used to perform multiple disciplines. It lets the user to monitor, troubleshoot, as well as report the network and operates a help desk.
Cacti- Cacti are a simple but powerful online application that is used to perform multiple disciplines. It lets the user to monitor, troubleshoot, as well as report the network and operates a help desk.
Zabbix- It is an open source soft ware that gives real time monitoring of various metrics which are composed from network devise, different servers, as well as virtual machine.
Icinga- It’s an open source tools that monitors the performance, availability of the servers. The software is designed to let the return of plug-ins to the data performance that is optional.
Open NMS- Open NMS is an open source network that is utilized by the various commercial enterprises or the business organization. The aim of using this software is to provide the resolution of the network monitoring. This is one of the extensible as well as flexible platforms which are quite appropriate for monitoring the interface, applications, network topologies, services, as well as IT ecosystem
WhatsUp Gold- This software helps in several network device presentations as well as various operating as the cloud. It provides complete information about the status and performance of the applications, servers, and network devices in the cloud.
Question 2. Discuss and evaluate in detail the server availability monitoring architecture.
Answer : Evaluation of Server Availability Monitoring Architecture
Monitoring the IT system or server is very essential for maintaining the health of an organization. In the present days more of a business is dependent on software, so it’s become critical to manage the server overall performance. This system can be on a private or a public cloud or combination of both. The working of the monitor systems is not predefined but there are few techniques and protocols that are commonly used by most of the server monitoring tools. The initial level of a monitoring tool consists of Simple Network Management Protocol or SNMP [8].
EXPERTSMINDS.COM ACCEPTS INSTANT AND SHORT DEADLINES ORDER FOR MN506 SERVER AVAILABILITY MONITORING AND METRICS ASSIGNMENT – ORDER TODAY FOR EXCELLENCE!
It forms a communication link between a monitoring platform, the device which is monitored and monitored data’s structure. The Simple Network Management Protocol monitoring tools at a regular interval connects with the monitored devices to read operational parameters [11]. The SNMP reads bytes in and bytes out for monitoring the network equipments .These is counters which indicates that what amount of data is received and sent to the servers. The monitoring system with the help of polling interval and simple mathematics, calculate average bandwidth utilization.
The Window Management Instrumentation (WMI) protocol is used in Windows to communicate between monitoring systems and monitored servers and for non Windows other protocols such as Web Based Enterprise Management (WBEM) or Common Information Model (CIM) is used [9].
Most of the monitoring systems communicate with monitored host through a locally installed agent. By implementing such local agents on the server have various advantages such as it provides the developers a flexibility regarding the complete control over the information. The local agent will have access to more data than standard protocols.
Details of Server Availability Monitoring Architecture
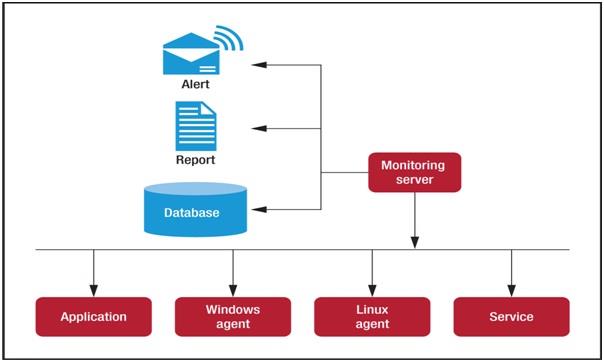
Figure: Server Availability Monitoring Architecture
T he above IT Server availability monitoring architecture consist of Application , Windows Agent, Linux, Service, Monitoring Server ,Database ,Report and Alert. The initial step in this process is monitoring the IT infrastructure at the service, hardware, and application levels. The tools need to be selected very carefully as it must aligns with the technical and business requirements. A proper understanding of tool is required, that how it will put impact on the business organization. As, this architecture of the IT infrastructure indicate that from different sources the data is collected and then it is forwarded to the monitoring servers for the depth analysis of the collected data [10]. The monitoring servers consist of three terms database, report, and alert.
The collected data is forwarded in the database for the storage, then from this gathered data a report and alert is generated for the monitoring administrator. The aim of any monitoring system to respond as quickly as possible to the server related issues, so in such case different alert methods is use such as short message service, email, custom scripts and etc. Microsoft Windows Update Agent (WUA) is an agent which works together with the Windows Server Update Service to provide delivery and installation. The information of widows is gathered in the database passing through by monitoring servers, which analyses and evaluates the data and creates an alert for the user which need attention. The automatically function of agents helps in installing the update patch in the system. The key terms related to the monitoring architecture are as follows.
DO YOU WANT TO EXCEL IN MN506 SERVER AVAILABILITY MONITORING AND METRICS ASSIGNMENT? HIRE TRUSTED TUTORS FROM EXPERTSMINDS AND ACHIEVE SUCCESS!
Rate of Error- It aims to denote the percentage wise rate of error that is intertwined with the requests those reflects on the responses with http code [13]. It evaluates the percentage of the application that has been unsuccessful.
Request per Second- It assesses the numbers of requests that are raised every second. It is use to understand the average load as well as the web application in a bulk at a workplace.
PRT- The full form of it is peak response times that are used in order to measure the milliseconds.
ART- ART or average response times are almost similar to peak response times. It illustrates which resource contains potential risk and can affect the entire system.
Usage of CPU- It is the amount of time that is utilized by a CPU. It is shown as a percentage which depicts the usage of the central processing unit.
Uptime- It is actually the amount of time that is needed by a server in order to ensure the fact that is working efficiently.
Memory utilization- The amount of memory which is used by a web application at the time of processing the particular request is known as memory utilization [12].
Risk Counts- At the time or processing the web application various thread are emerged. The thread is inversely related with the processing time that is required by the several requests.
Question 3. Propose a solution to avoid data vulnerability in server availability monitoring tools.
Answer : Proposal In Order To Prevent the Data Vulnerability Issue
The above discussion illustrates that several problems can arise in case of using the server monitoring tools. However, there are definitely some ways to avoid the vulnerability of the information or data, such as,
• Take adequate measure in order to prevent the threat.
• Check the system thoroughly with the help of Nikto, OpenVAS as well as scanner Aircrack in order to identify the feeble areas in the entire system.
• The business organization should provide proper training to the admin so that, he can handle the server monitoring tool smoothly and effectively.
• All the equipments and the devices that are used in the organization need to be traced thoroughly in order to avoid the vulnerability problems of data.
• The admin of an organization needs to use strong password so that no one can hack the system.
• The employees of an organization need to be updated regarding the latest vulnerability issue of data.
• The organization needs to encourage the utilization of VPN or virtual private network in order to minimize the risk of data feebleness.
Question 4. Discuss the impact of failure prediction on server availability monitoring.
Answer :
From the above discussion it is clear that the appropriate monitoring of the IT servers is very crucial for all the business organization in order to perform their every day’s task smoothly. However the appropriate monitoring process also has to face several challenges such as, low bandwidths availability, high disk usage, no default gateway, high downtime and unavailability of hardware as well as the services. The studies describes the different server monitoring software like Icinga , Zabbix, Nagios core, cacti, Spiceworks and many more, their advantages and loopholes. With the help of correct measurement the software has been chosen that is most suitable. There is no doubt that in order to keep balance with the changing circumstances it has become more essential to use server monitoring tools for the commercial enterprise needs.
SAVE YOUR HIGHER GRADE WITH ACQUIRING MN506 SERVER AVAILABILITY MONITORING AND METRICS ASSIGNMENT HELP & QUALITY HOMEWORK WRITING SERVICES OF EXPERTSMINDS.COM
Listed below some of the major courses and academic units cover under our Melbourne Institute of Technology, Australia Assignment Help Service:-
- MN601 Network Project Management Assignment Help
- MN603 Wireless Networks and Security Assignment Help
- MN621 Advanced network Design Assignment Help
- MN691 Research Methods and Project Design Assignment Help
- MN501 Network Management in Organisations Assignment Help
- MN502 Overview of Network Security Assignment Help
- MN503 Overview of Internetworking Assignment Help
- MN507 Overview of Software Engineering Assignment Help
- MN611 System Architecture Assignment Help
- MN612 Enterprise Architecture Assignment Help
- MN622 Software Defined Networking Assignment Help