GET ASSURED A++ GRADE IN EACH HI5002 COMPANY PERFORMANCE ANALYSIS ASSIGNMENT ORDER - ORDER FOR ORIGINALLY WRITTEN SOLUTIONS!
HI5002 Finance for Business - Company Performance Analysis Assignment - Holmes Institute, Australia
Purpose - The assignment should examine the main issues, including underlying theories, implement performance measures used and explain the firm financial performance.
Assignment Tasks - This assignment task is a written report and analysis of the financial performance of one selected listed company on the ASX in order to provide financial and investment advice to a wealthy investor. This assignment requires your group to undertake a comprehensive examination of a firm's financial performance based on update financial statements of the selected company.
STAGES TO BE COMPLETED -
1. Description of operation and comparative advantages of the selected company.
2. Identify and conduct a trend analysis with two groups of financial ratios, including profitability, and operating efficiency of the selected company.
3. Identify the marketable securities that are available in current assets of the company. Discuss using of these securities as an instrument for cash management by the company.
4. Perform a sensitivity analysis with data provided.
5. Identify and discuss the systemic risks and un-systemic risks that may affect performance of the selected company.
6. Calculate the dividend payout ratio and comment on the dividend policy of the chosen company through 3 years.
7 Recommendation Letter.
Answer - Finance for Business
Abstract
This particular project generally indicates the Performance ratios of Amcor Limited. Liquidity Ratio, Profitability ratios, cash flow adequacy ratio has been calculated along with the dividend payout ratio in this study. Each of the factors that have been described in this study will help to gain in-depth knowledge with a view to economical business factors of Amcor Limited and its market operations. Considering the first factor, cash flow adequacy ratio, it has been possible to identify the financial condition of the company under different circumstances that will help the company develop a market strategy plan to meet the company issues in the near future. On the other hand, a sensitivity analysis has been performed based on given data, and that will reflect all the independent variables that influence the Net Present value as well as the overall financial position of the organization. Various financial factors were described in this study that can affect both internal and external economic conditions of the materials industry.
NO PLAGIARISM POLICY - ORDER NEW HI5002 COMPANY PERFORMANCE ANALYSIS ASSIGNMENT & GET WELL WRITTEN SOLUTIONS DOCUMENTS WITH FREE TURNTIN REPORT!
I) Introduction
In present days financial management is one of the essential parts of every business organisation. Using effective strategies generally provides the organisation higher competitive advantages in the operating market leads to increase organisational financial position as well as the brand image (Foschi and Bonoli, 2019). The senior management of the organisation is also focused on economic analysis that helps to recognise the overall trends of an organisation. Performance analysis helps management to make an effective strategic decision with a view to organisational growth. The main objective of this study is to calculate the financial ratios of Amcor, and that is important to understand both the current and previous financial position of the organisation (Whitehead et al., 2019). Identification of Liquidity ratio, efficiency ratio, Profitability ratio is essential for the organisation to improve the overall sales and service (Barr and McClellan, 2018). Make strategies based on financial performance also improves organisational research development works. On the business organisations also perform ratio and performance analysis during the internationalisation process to identify the overall strength and weakness that will provide the company huge advantage in the competitive foreign market.
Apart from that, cash management analysis, sensitivity analysis of Amcor will help management to identify the uncertainty quantification that is essential to recognise the value of products and the overall sales performance of the organisation (Foschi and Bonoli, 2019). It generally signifies the effect of independent variables on dependent variables. The management can understand that how one variable affects the outcome of other variables. That means it will help the senior management of Amcor make effective decision or strategies to triggers the services of the organisation leads to gain effective financial benefits in the operating industry (Navarro et al., 2019). This particular project also signifies the dividend pay-out policies of Amcor and compares the policies with the overall market environment of the packaging industry of Australia that is important for Amcor Limited to understand its current position in an efficient manner.
II) Financial analysis of Amcor
2.1 Overview of the Organization
Amcor is one of the popular packaging companies in Australia that expand its business all over the world. This organisation generally produces flexible products such as rigid containers, medical devices, cartons, pharmaceuticals products, personal care products and many more (Knox et al., 2019). It is a famous ASX listed company, and the head office of this organisation is in Southbank, Australia. At the same time, the corporate headquarter of this organisation is in Zurich, Switzerland. More than 35000 employees are currently working in this organisation that means the overall workforce of the organisation is excellent to expand the business in other foreign markets (Amcor Limited, 2019).
ENDLESS SUPPORT IN HI5002 COMPANY PERFORMANCE ANALYSIS ASSIGNMENTS WRITING SERVICES - YOU GET REVISED OR MODIFIED WORK TILL YOU ARE SATISFIED WITH OUR HI5002 COMPANY PERFORMANCE ANALYSIS ASSIGNMENT HELP SERVICES!
On the other hand, in the financial year 2018 the overall revenue of the company was $9.3 billion. It generally signifies the significant strength as well as the financial strength of Amcor Limited. The chief executive officer of this company is Ron Della. This company has two major reporting segments such as flexible packaging segment and a rigid plastic segment. Amcor is the world's largest rigid plastic supplier so that the overall brand image of the organisation is so high (Li et al., 2019). This company was also known as "Australian paper manufacturer", and after merger and acquisition, this organisation developed its segments by utilising various market opportunities.
This organization generally focused on People that mean the efficient and high-performance Amcor team, Customers, Investors and the overall market environment and that usually helps the team to grow its business rapidly in the global market (Amcor Limited, 2019). The mission of Amcor is to be global leaders by efficiently reducing environmental issues. For that reason, the higher management is trying to develop all its packaging 100% recyclable or reusable by 2025. In this regard, the company also committed to increase the use of recycled materials to control the level of pollution for that reason this group also engaged with various corporate social responsibility programs to make the overall operation sustainable.
2.2 Calculate and Analyse the Performance ratio of Amcor
Performance analysis is essential for all the business organization and that mainly provides the company with higher competitive advantages in operating market (Guo and Wang, 2019). Various performance ratios such as liquidity ratio, Debt ratio, operating performance ratio, Profitability ratio also helps an organization to understand its current financial as well as market position that is urgent to make the instant decision regarding organizational growth or development.
|
year
|
2016 (Million)
|
2017 (Million)
|
2018 (Million)
|
|
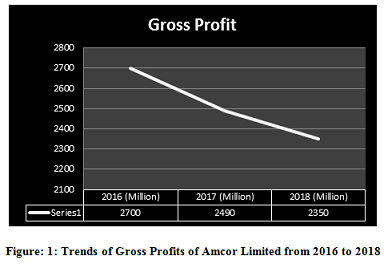
Gross Profit
|
2700
|
2490
|
2350
|
|
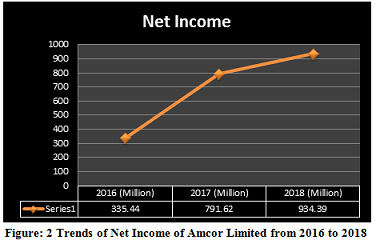
Net Income
|
335.44
|
791.62
|
934.39
|
According to gathered data, it has been identified that in the financial year 2016 the gross profit of the organization was $2700 million and the overall gross profit of the organization also reduced in 2018 by $350 million. That means total sales of the organization also decreased.
At the same time, it has been identified that the net income of Amcor also increased in comparison to the previous year (Guo and Wang, 2019). This increasing trend quickly signifies that the overall profit margin of the company increased in comparison to previous financial years. It also signifies that the operating expense of Amcor also reduced in comparison to last years.
HELPING STUDENTS TO WRITE QUALITY HI5002 COMPANY PERFORMANCE ANALYSIS ASSIGNMENT AT LOW COST!
Profitability Ratios of Amcor
|
Profitability ratios
|
Formula
|
2016
|
2017
|
2018
|
|
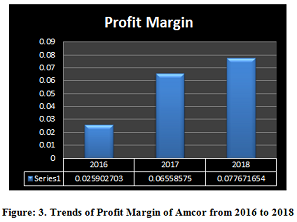
Profit margin
|
Net income/ Revenue
|
0.025902703
|
0.06558575
|
0.077671654
|
|
ROA
|
Net Income/ Total Asset
|
0.028768439
|
0.066859797
|
0.076339052
|
|
ROE
|
Net income/ Shareholders Equity
|
0.319466667
|
0.761173077
|
0.677094203
|
|
Asset Turnover
|
Revenue/Total Asset
|
1.110634648
|
1.019425676
|
0.982843137
|
Based on the below chart it has been identified that the overall organizational profit margin increased. In the financial year 2016, the profit margin of Amcor was 0.0259, but it increased rapidly, and in 2018 the profit margin of the organization was 0.0776 (MarketWatch, 2019). That means the profit margin increased 66.65% during three years of operation. It also indicates that the pricing of products also increased and the senior management took effective strategies to improve the overall organizational position efficiently.
At the same time return on Asset and Return on Equity also increased in comparison to previous years it generally indicates that the overall income of the organization also increased. It also helps to measure how the management team is performing their duties in managing the capital for this business (MarketWatch, 2019). According to the analysis, the asset turnover ratio of Amcor limited reduced. The organization would gradually turnover its assets through sales and services.
Liquidity Ratios of Amcor Limited
|
Liquidity Ratios
|
Formula
|
2016
|
2017
|
2018
|
|
Current Ratio
|
Current Asset/Current liabilities
|
0.875510204
|
0.813688213
|
0.699685535
|
|
Working capital
|
Current Asset-Current liabilities
|
-610
|
-980
|
-1910
|
|
Receivable turnover
|
Net Credit Sales/ Average Account receivable
|
7.194444444
|
6.976878613
|
7.380368098
|
|
Inventory turnover
|
Cost of Goods Sold/ Inventory
|
6.137724551
|
5.635294118
|
5.260869565
|
|
Average days' sales uncollected
|
(Account Receivable/ Net sales)*365
|
50.73359073
|
52.31565866
|
49.45552785
|
|
Average days' inventory on hand
|
365/Inventory turnover
|
59.46829268
|
64.77035491
|
69.38016529
|
GET READYMADE HI5002 COMPANY PERFORMANCE ANALYSIS ASSIGNMENT SOLUTIONS - 100% PLAGIARISM FREE WORK DOCUMENT AT NOMINAL CHARGES!
Liquidity ratio is one of the essential parts of financial management that usually signifies the ability of debtors to pay its all current debt obligations without any external investment (William et al., 2019). The current ratio of Amcor reduced. The working capital, Inventory turnover, Average day's sales also decreased that means it signifies the inadequate degree of liquidity. The company may face financial risk in future (Elghaish et al., 2019). For that reason the management team needs to evaluate the current position of this organization for strategic development leads to generate more sales to reduce the level of risk effectively.
2.3 Cash Management Analysis of Amcor
Cash management is a vital part of financial management, and all the business organizations are using various strategies to increase the level of cash flow for operating and investing activities that will help management to improve company's financial position in a quicker manner (Wu and Chiang, 2019). From the cash flow statement of Amcor Limited, it has been identified that the working capital of Amcor reduced in comparison to previous years. In the financial year 2017 and 2018 the operating cash flow reduced. It is one of the significant upcoming threats for this organization (Salas-Molina et al., 2019). Capital expenditure of this company increased, and it also reduces the profit percentage of this company. For more cash flow Amcor needs to reduce the overall Operating expenses and also needs to use an effective pricing strategy to improve the organizational financial health as soon as possible.
Cash Flow Adequacy Ratio
|
Cash flow Adequacy
|
Formula
|
2016
|
2017
|
2018
|
|
Cash flow yield
|
Cash flow from Operation/Net Profit
|
4.501550203
|
1.717996008
|
1.294962489
|
|
Cash flows to sales
|
Operating Cash Flow/ Net Sales
|
0.116602317
|
0.112676056
|
0.100581879
|
|
Cash flows to assets
|
Cash flow from Operation/Total Assets
|
0.129502573
|
0.114864865
|
0.098856209
|
It mainly signifies that the cash flow of Amcor is sufficient or not to fulfil all the short and long term liabilities in an efficient manner (MarketWatch, 2019). From the above table, it has been identified that the cash flow from operation reduced. At the same time, cash flow to sales ratio and operating cash flow to asset ratio also decrease than previous years that means the organization needs to increase both profit margin as well as sales volume to manage the day to day operations in an effective manner.
MOST RELIABLE AND TRUSTWORTHY HI5002 COMPANY PERFORMANCE ANALYSIS ASSIGNMENT HELP & HOMEWORK WRITING SERVICES AT YOUR DOORSTEPS!
2.4 Sensitivity Analysis Based on Given Data
Sensitivity analysis is an important part of cost accounting that generally signifies the effect of various independent variables on Net Present value of the Project. NPV value mainly indicates the difference between Net Present cash inflow and Net Present cash Outflow (Salas-Molina et al., 2019). According to the case study, it has been identified that Price of Each product is $20. At the same time, this company can sale 300,000 products per year. The variable cost of the product is $12/ Product that means the Profit is $8/ product. That means the total Gross Profit of the organization is 300,000*8 = 24,00,000. After 30% tax deduction the overall cash inflow per year is (24,00,000*70)/100 = 168000.
|
Total Investment cost of the Project
|
|
Equipment cost
|
2000000
|
|
Residual cost
|
200000
|
|
Working capital
|
600000
|
|
Cash Fixed cost per year (300000 / year)
|
1200000
|
|
Total Investment Cost
|
4000000
|
That means the NPV Value of the Project is {1680000/(?1+0.10)?^1+1680000/(?1+0.10)?^2+1680000/(?1+0.10)?^3+1680000/(?1+0.10)?^4}-40,00,000 = 1325373.95
That means high Net present value indicates that the business is profitable for the investors. There are different factors that can influence the Net Present value of a business.
|
Price/ Unit
|
Variable cost Per Unit
|
Profit/Unit
|
Unit sales
|
Gross Profit
|
Cash Inflow after tax deduction
|
|
20
|
12
|
8
|
300000
|
2400000
|
1680000
|
|
Price/ Unit
|
Variable cost Per Unit
|
Profit/Unit
|
sales 10% decreased
|
Gross Profit
|
Net Profit After Tax
|
|
20
|
12
|
8
|
270000
|
2160000
|
1512000
|
|
Price/ Unit decreased by 10%
|
Variable cost Per Unit
|
Profit/Unit
|
Unit sales
|
Gross Profit
|
Net Profit After Tax
|
|
18
|
12
|
6
|
300000
|
1800000
|
1260000
|
|
Price/ Unit
|
Variable cost Per Unit 10% increased
|
Profit/Unit
|
Unit sales
|
Gross Profit
|
Net Profit After Tax
|
|
20
|
13.2
|
6.8
|
300000
|
2040000
|
1428000
|
SAVE DISTINCTION MARKS IN EACH HI5002 COMPANY PERFORMANCE ANALYSIS ASSIGNMENT WHICH IS WRITTEN BY OUR PROFESSIONAL WRITER!
|
Total Investment cost of the Project
|
|
Equipment cost
|
2000000
|
|
Residual cost
|
200000
|
|
Working capital
|
600000
|
|
Cash Fixed cost per year (300000 / year)
|
1200000
|
|
Total Investment Cost
|
4000000
|
Sales 10% decreased
If the Unit of sales 10% decreased than total sales will be (300000*90)/100 = 270000. After tax deduction the Net Profit of the organization will be $15,12,000.
In this case the Total NPV Value of the Project will be = {1512000/(?1+0.10)?^1+1512000/(?1+0.10)?^2+1512000/(?1+0.10)?^3+1512000/(?1+0.10)?^4-40,00,000= 792836.5549
That means if the sales volume of the organization reduced by 10% then Net Present value of the business will be reduced by {(1325373.95 - 792836.5549)/ 1325373.95}× 100 = 40%. The profit margin of the business will reduce and it will also affect the business negatively.
Price/Unit decreased by 10%
The Product Price of each product is $20 and if the price decreased by 10% then the cost of per Product will be $18 that means Profit per product will be $6. Total cash flow after deduction of 30% tax is = 1260000.
In this case the Total NPV Value of the Project will be = {1260000/(?1+0.10)?^1+1260000/(?1+0.10)?^2+1260000/(?1+0.10)?^3+1260000/(?1+0.10)?^4-40,00,000= -5969.5376
The Net Present value is negative that means if the Product Price Per unit Reduced by 10% then an investor will face massive loss from the project work (Zhang, Nielson and Haley, 2019). For that reason, sensitivity analysis is essential for all the business organization during project planning, and it will reduce the chances of risk and provide investors with various competitive benefits during project work.
HIRE PROFESSIONAL WRITER FROM EXPERTSMINDS.COM AND GET BEST QUALITY HI5002 COMPANY PERFORMANCE ANALYSIS ASSIGNMENT HELP AND HOMEWORK WRITING SERVICES!
Variable cost Increased by 10%
The variable cost of each product is 12 and if the variable cost increased by 10% then the variable cost per product will be $13.2/ Product. Profit per Product is = 6.8 and total cash inflow after deduction of 30% tax is = 1428000.
In this case the total value of NPV of the Project will be = {1428000/(?1+0.10)?^1+1428000/(?1+0.10)?^2+1428000/(?1+0.10)?^3+1428000/(?1+0.10)?^4-40,00,000= 526567.8574
In this case the Net Present Value of the project is positive but the overall NPV of the business will reduced by {(1325373.95 - 526567.8574)/ 1325373.95} × 100 = 60.27% reduced. It will create negative impact in the business and the chances of risk is also high for that reason the management needs to take advance strategies to mitigate all the problems by increasing profit margin as well as sales volume.
Fixed cost Increased by 10%
Based on given data it has been identified that the fixed cost of the organization was $300,000. So 10% increased means (300,000×110)/100 = 330000 / year. For 4 years the cost will be 330000×4 = 1320000.
The NPV of the business will be = {1680000/(?1+0.10)?^1+1680000/(?1+0.10)?^2+1680000/(?1+0.10)?^3+1680000/(?1+0.10)?^4}-41,20,000 = 1205373.95
The value of NPV reduced but the reduction percentage is very low such as = {(1325373.95 - 1205373.95) / 1325373.95} × 100 = 9.054%. It generally signifies that Increase of fixed cost generally reduces the rate of profits. For that reason the Amcor Limited needs to take effective strategies to reduce organizational fixed costs leads to further organizational growth.
2.5 Discuss Both the Systemic and Un-Systemic Risks That Can Affect Organizational Performance
Systemic risk generally refers to the possibility that can collapse the overall business industry. Market risk, Inflation risk, Market risk can influence the overall financial position of Amcor Negatively (Wu and Chiang, 2019). Systemic risk can hamper the global economic situation of the company so that the management team will not get sufficient money to operate day to day works effectively and it will hamper the overall business performance. In systemic risk the capital market will freeze up for that reason business will not get loans from the market leads to collapse the company permanently.
At the same time, Un-systemic risk refers to the risk that is associated with a specific organisation. The company can control the Un-systemic risk and the internal factors of a company generally responsible for this risk (Zhang, Nielson and Haley, 2019). For that reason, it is essential for Amcor to analyse the business risk frequently to make changes to reduce the chances of risk factors. In this regard, a company can take different marketing strategies as well as organisational strategies to improve its performance quickly.
WE HELP STUDENTS TO IMPROVE THEIR GRADES! AVAIL TOP QUALITY HI5002 COMPANY PERFORMANCE ANALYSIS ASSIGNMENT HELP AND HOMEWORK WRITING SERVICES AT CHEAPER RATE!
2.6 Recognition of dividend payout ratio and dividend policy
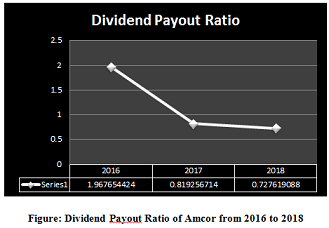
Dividend payout ratio indicates the amount of dividend that the company gives to its shareholders from its current earnings (Elghaish et al., 2019). In the financial year 2016, the dividend payout ratio of the organization was 1.967. In 2018 the rate was 0.72. Reduced pay-out ratio signifies that the net income of the company increased in comparison to previous years. Amcor Limited needs to use residual dividend policies, and it will increase the organizational profitability more in upcoming financial years (Farndale et al., 2019). Company will pay the shareholders a specific dividend after the payment of all capital expenditure and working capitals. It will help this company to manage the overall financial position in volatile market condition.
|
|
Formula
|
2016
|
2017
|
2018
|
|
Dividend Pay-out Ratio
|
Dividend Per Share / Earning Per Share
|
1.967654424
|
0.819256714
|
0.727619088
|
III) Recommendation letter
To
The Managing Director
Amcor Limited
Southbank
Australia
Respected Sir,
According to the ratio analysis of Amcor Limited, it has been recorded that net income of this organization increased in comparison to previous years and financial year 2018 the net income of Amcor Limited was $934.39 million. The profit margin of Amcor also increased, but the overall sales volume of the company reduced in comparison to previous years. The liabilities of Amcor increased for that reason the working capital of this company is negative. For that Reason, the Company needs to increase its sales volume and also needs to expense more in marketing activities to generate more outputs from operating industries.
Apart from that the senior management of Amcor Limited needs to reduce the number of bad debts and capital expenditure. At the same time, the company needs to use effective Product and pricing strategies based on market research that will help to grab the attention of more clients' leads to increase financial profitability as well as working capital. Invest more time and labour in research development works will improve product quality leads to gain more competitive advantages in the operating industry.
IV) Conclusion
The above study signifies the financial position and sensitivity study of Amcor Limited. According to the ratio analysis, it has been identified that organisational profit margin increased by 52% in 3 years. At the same time profit margin of the company also increased but the working capital of Amcor Limited is negative so the company has the risk of the financial crisis in future and that can affect the overall performance leads to the permanent collapse of the business. The current ratio of the company reduced that means now Amcor has less ability to pay off its current liabilities effectively. Not only the Profit margin but it is also essential for this company to improve its production and sales effectively for that reason the management teams needs to use effective strategic changes in the organisation to generate more revenues.
Apart from that, based on given data, sensitivity analysis of Amcor has been performed, and it has been recorded that Net Present value of the project was $1325373.95. That means it is profitable for this company but if some risk factor works such as decrease the sales rate, reduction of product price can affect the NPV of this project negatively, and organisation will face huge loss from this project work. For that reason, senior management needs to analyse both systemic and Un-systemic risk effectively to avoid the upcoming risk factors.
NEVER MISS YOUR CHANCE TO EXCEL IN HI5002 COMPANY PERFORMANCE ANALYSIS ASSIGNMENT! AVAIL AFFORDABLE AND RELIABLE HI5002 COMPANY PERFORMANCE ANALYSIS ASSIGNMENTS HELP SERVICES OF EXPERTSMINDS.COM!
Avail the best Holmes Institute Assignment Help Services for its related course and academic units, such as:-
- HI5001 Accounting for Business Decisions Assignment Help
- HI5003 Economics for Business Assignment Help
- HI5017 Managerial Accounting Assignment Help
- HI5019 Strategic Information Systems for Business and Enterprise Assignment Help
- HI5020 Corporate Accounting Assignment Help
- HI6025 Accounting Theory and Current Issues Assignment Help
- HI6026 Audit, Assurance, and Compliance Assignment Help
- HI6027 Business and Corporate Law Assignment Help
- HI6028 Taxation Theory, Practice and Law Assignment Help
- HI 6007 Statistics for Business Decisions Assignment Help
- HI 6008 Business Research Assignment Help