ECON1030 - Business Statistics, RMIT University, Australia
ARE YOU LOOKING FOR RELIABLE ECON1030 - BUSINESS STATISTICS ASSIGNMENT HELP SERVICES? EXPERTSMINDS.COM IS RIGHT CHOICE AS YOUR STUDY PARTNER!
Question 1: Locate the data file (Assignment_BusStats.xls) on CANVAS.
A. Use the most appropriate type of graph to present the weekly closing price of Bitcoin (BIT) and provide a general description, commenting on the trend. [Topic 1]
B. Calculate the weekly return for BIT and construct a histogram. Does the data on return rates appear normally distributed? On the basis of z-scores do you find evidence of outliers? Hint: the formula for a return is (Current Price - Previous price)/Previous price multiplied by 100. [Topics 1-4]
C. Calculate and interpret the three aspects of Descriptive Analysis for weekly return: Location, Shape and Spread. Hint: make sure you interpret these measures in the context of the data and pay attention to the unit of measurement.
D. Construct a 95% confidence interval for BIT return and interpret the interval.
E. An investment advisor claimed that BIT return is 2%. Do you agree? Justify your reasoning using a two-tailed hypothesis test approach at the significance level of 5%.
F. Repeat steps 1-5 above for another financial stock traded at the Australia Securities Exchange: the Macquarie Group Limited (MAC).
G. Explore the association between BIT and MAC returns. Specifically, construct a contingency table for the positive and non-positive returns of the two stocks and calculate the following: a) Prob (BIT return is positive), b) Prob (MAC return is positive), and c) Prob (positive BIT return conditional on positive MAC return). Are returns to BIT and MAC statistically independent? Hint: use the IF function in excel to construct the four joint events: +ve and +ve returns, +ve and -ve returns, -ve and +ve returns, -ve and -ve returns.
Answer: Executive Summary: The main objective of this study is to determine the proper use of statistical tools. The variables taken into consideration for this study is BIT and MAC. The mean BIT is 3645.45 ± 4935 and the median BIT value is 829.08 and mean MAC is 82.09 ± 25.75 and the median MAC value is 81.36. The study findings suggest that there is no linear relationship between BIT and MAC, indicating that there exists nonlinear relationship between BIT and MAC. Thus, we can say that these variables depends on time
Introduction: The main objective of this study is to determine the proper use of statistical tools. The random variables are normally classified as either qualitative or quantitative variables. The use of statistical tools will differ based on the variables taken into consideration. If we are trying to find the relationship between one continuous variable and one categorical variable, then, the appropriate statistical test is either independent sample t test (comparing two group mean) or one way ANOVA
Statistical Analysis: Descriptive statistics was used for continuous variables and frequency distribution and bar chart was used for qualitative variables to assess the distribution of those variables. Pearson correlation coefficient was used to determine the relationship between two continuous variables. Independent sample t test or Mann Whitney U test was used to find the difference in mean between two groups. Sensitivity and specificity analysis was used to assess the ability of the test used.
EXPERTSMINDS.COM ACCEPTS INSTANT AND SHORT DEADLINES ORDER FOR ECON1030 - BUSINESS STATISTICS ASSIGNMENT – ORDER TODAY FOR EXCELLENCE!
Descriptive Statistics: The descriptive statistics for the variables BIT and MAC is given below
|
|
BIT
|
MAC
|
|
Mean
|
3645.45
|
82.09
|
|
Standard Error
|
269.23
|
1.40
|
|
Median
|
829.08
|
81.36
|
|
Mode
|
|
58.30
|
|
Standard Deviation
|
4935.00
|
25.75
|
|
Sample Variance
|
24354245.71
|
663.20
|
|
Kurtosis
|
2.28
|
-0.87
|
|
Skewness
|
1.64
|
0.27
|
|
Range
|
25934.49
|
101.13
|
|
Minimum
|
52.06
|
34.86
|
|
Maximum
|
25986.55
|
135.99
|
|
Sum
|
1224872.23
|
27580.87
|
|
Count
|
336
|
336
|
The mean BIT is 3645.45 ± 4935 and the median BIT value is 829.08, indicating that nearly 50% of the sample BIT value falls below 829.08 and nearly 50% of the sample BIT value falls above 829.08. The recorded minimum and maximum BIT value 52.06 and 25986.55 respectively. On comparing the mean and median of BIT, we can say that the distribution of BIT has longer tail towards the right side of the normal curve, indicating that the distribution of BIT is skewed right or positively skewed
The descriptive statistics for the variables BIT and MAC is given below
|
|
BIT
|
MAC
|
|
Mean
|
3645.45
|
82.09
|
|
Standard Error
|
269.23
|
1.40
|
|
Median
|
829.08
|
81.36
|
|
Mode
|
|
58.30
|
|
Standard Deviation
|
4935.00
|
25.75
|
|
Sample Variance
|
24354245.71
|
663.20
|
|
Kurtosis
|
2.28
|
-0.87
|
|
Skewness
|
1.64
|
0.27
|
|
Range
|
25934.49
|
101.13
|
|
Minimum
|
52.06
|
34.86
|
|
Maximum
|
25986.55
|
135.99
|
|
Sum
|
1224872.23
|
27580.87
|
|
Count
|
336
|
336
|
SAVE DISTINCTION MARKS IN EACH ECON1030 - BUSINESS STATISTICS ASSIGNMENT WHICH IS WRITTEN BY OUR PROFESSIONAL WRITER!
The mean MAC is 82.09 ± 25.75 and the median MAC value is 81.36, indicating that nearly 50% of the sample MAC value falls below 81.36 and nearly 50% of the sample MAC value falls above 81.36. The recorded minimum and maximum MAC value 34.86 and 135.99 respectively. On comparing the mean and median of MAC, we can say that the distribution of MAC has equal tail width on both sides of the normal curve, indicating that the distribution of MAC follows normal distribution
Relationship between BIT and MAC: In order to determine the relationship between BIT and MAC, we construct scatter plot
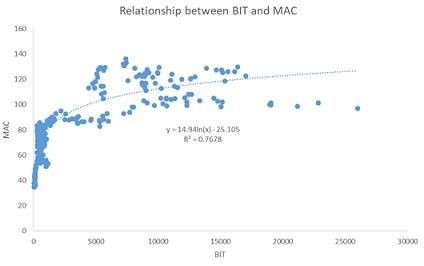
From the above scatter plot, we see that there is no linear relationship between BIT and MAC, indicating that there exists nonlinear relationship between BIT and MAC. Thus, we can say that these variables depends on time
Regression Model: The regression model was constructed to predict the MAC value based on BIT and time. The regression equation is
MAC = b0 + b1 * Time + b2 * BIT
The regression output is given below
SUMMARY OUTPUT
|
Regression Statistics
|
|
Multiple R
|
0.95863911
|
|
R Square
|
0.91898894
|
|
Adjusted R Square
|
0.91850238
|
|
Standard Error
|
7.35179654
|
|
Observations
|
336
|
ANOVA
|
|
df
|
SS
|
MS
|
F
|
Significance F
|
|
Regression
|
2
|
204172.5
|
102086.2
|
1888.775
|
1.9E-182
|
|
Residual
|
333
|
17998.29
|
54.04891
|
|
|
|
Total
|
335
|
222170.7
|
|
|
|
|
|
Coefficients
|
Standard Error
|
t Stat
|
P-value
|
Lower 95%
|
Upper 95%
|
|
Intercept
|
40.4475901
|
0.860686
|
46.99458
|
5.1E-149
|
38.75452
|
42.14066
|
|
Time
|
0.24124253
|
0.00612
|
39.41963
|
1.8E-127
|
0.229204
|
0.253281
|
|
BIT
|
0.00033746
|
0.00012
|
2.801396
|
0.005386
|
0.0001
|
0.000574
|
From the above output, we see that
MAC = 40.448 + 0.241 * Time + 0.00034 * BIT
The coefficient of determination is 0.919, which clearly indicates that the dependent variable MAC variation of 91.9% was clearly explained by the regression model while the left out variation of 8.1% remains unexplained
The overall significance model was validated using F test for overall significance. Here, the p - value was found to be less than 0.05, indicating that the estimated regression model is good fit in predicting MAC
NEVER BE CAUGHT IN PLAGIARISM, AVAIL ECON1030 - BUSINESS STATISTICS ASSIGNMENT HELP SERVICE OF EXPERTSMINDS.COM AND SAVE HIGHER MARKS!
Conclusion: The main objective of this study is to determine the proper use of statistical tools. The random variables are normally classified as either qualitative or quantitative variables. The mean BIT is 3645.45 ± 4935 and the median BIT value is 829.08, indicating that nearly 50% of the sample BIT value falls below 829.08 and nearly 50% of the sample BIT value falls above 829.08. The mean MAC is 82.09 ± 25.75 and the median MAC value is 81.36, indicating that nearly 50% of the sample MAC value falls below 81.36 and nearly 50% of the sample MAC value falls above 81.36. The regression equation to predict MAC using Time and BIT is given below
MAC = 40.448 + 0.241 * Time + 0.00034 * BIT
The coefficient of determination is 0.919, which clearly indicates that the dependent variable MAC variation of 91.9% was clearly explained by the regression model while the left out variation of 8.1% remains unexplained
Question 2: Write a ministerial brief of no more than 200 words containing no more than three graphs on whether you can confidently recommend investing in the Bitcoin, as compared with MAC. Hint: draw on the relevant evidence you have gathered from Part A, as well as other information/evidence not covered here but you believe is useful.
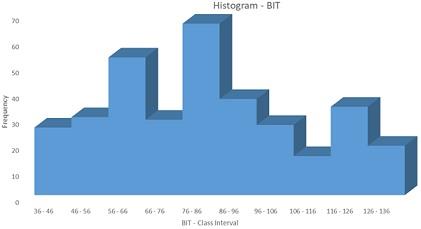
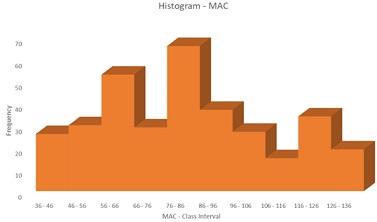
Answer: The main objective of this study is to determine the proper use of statistical tools. The random variables are normally classified as either qualitative or quantitative variables. Descriptive statistics was used for continuous variables and frequency distribution and bar chart was used for qualitative variables to assess the distribution of those variables. Pearson correlation coefficient was used to determine the relationship between two continuous variables. Independent sample t test or Mann Whitney U test was used to find the difference in mean between two groups. Sensitivity and specificity analysis was used to assess the ability of the test used. The Histogram for the two variables BIT and MAC is given below
From the above graph, it clearly shows that the variable BIT has outliers and hence do not follow normal distribution while the variable MAC follows normal distribution approximately. The mean BIT is 3645.45 ± 4935 and the median BIT value is 829.08. The mean MAC is 82.09 ± 25.75 and the median MAC value is 81.36. The study findings suggest that there is no linear relationship between BIT and MAC, indicating that there exists nonlinear relationship between BIT and MAC. Thus, we can say that these variables depends on time.
GET ASSURED A++ GRADE IN EACH ECON1030 - BUSINESS STATISTICS ASSIGNMENT ORDER – ORDER FOR ORIGINALLY WRITTEN SOLUTIONS!
Avail Custom-Made RMIT University, Australia Assignment Help Services For Its Related Course And Major Academic Units, Such As:
- ECON1562 Regulation And Governance In The Cryptoeconomy Assignment Help
- ECON1339 Behavioural Business Assignment Help
- ECON1314 Quantitative Methods Assignment Help
- ECON1259 Development Economics Assignment Help
- ECON1195 Financial Econometrics Assignment Help
- ECON1095 Quant Methods in Finance Assignment Help
- ECON1086 International Trade Assignment Help
- ECON1066 Basic Econometrics Assignment Help
- ECON1061 Quantitative Analysis Assignment Help
- ECON1048 Price Theory Assignment Help
- ECON1020 Prices and Markets Assignment Help
- ECON1010 Macroeconomics 1 Assignment Help