GET BENEFITTED WITH QUALITY BUSS-B 2012 RESEARCH METHODS, DATA ANALYTICS AND PROJECT PLANNING ASSIGNMENT HELP SERVICE OF EXPERTSMINDS.COM
BUSS-B 2012 Research Methods, Data Analytics and Project Planning - Middle East College
Learning Outcome 1. Design a project plan for business improvement.
Learning Outcome 2. Distinguish the different distributions in statistics.
Learning Outcome 3. Present research findings and opportunities for improvement.
Introduction
The report contains the statistics analysis of a logistics inc. company. To do the analysis the dataset of the company is cleaned using suitable criteria then, various insights are developed using the cleaned data set of the company. The frequency table of different brands that the company sells is made and a bar chart is plotted using the frequency table of the brand. The report also shows summary statistics of number of pieces per year and classified frequency table for weight per article. The report demonstrates the analysis of the dataset with help of box plots and bar chart.ABC analysis of the inventory is also carried out to gain insights into different articles that which are in high demand and which do not have ant demand. Then, a regression model is developed to determine the emergency orders which have three variables as order picking, packaging and shipping. To recognize the relationship between the various variables scatter plots are also plotted
Literature Review
Kim, J. (2012) says regression is the statistical technique of predicting value of dependent variable from two or more independent variables. There can be two types of regression linear and multiple regression. When there is one dependent and one independent variable then it is called linear regression and when there are more than one independent variable predicting a dependent variable then it is known as multiple regression. Meissner, G. (2015) gave a statement on correlation that correlation tells the degree of relationship between two variables. How much two variables are dependent on each other is indicated by correlation coefficient. If the value of correlation coefficient is near to 1 then, it indicates high degree of correlation between two variables. Runnenburg, J. (1978). Gives his view point on the descriptive statistics saying to summarise quantitative data we can use various measures such as mean , median , mode, standard deviation , range, quartiles and many more. Mean give the average value of the quantitative data. Median gives the central value of the quantitative data and mode gives the value that occurs maximum time in the given data. Together these measures are known as descriptive statistics. Brereton, R. (2014). says normal distribution is a distribution which shows symmetric distribution of a variable and in normal distribution all the three measures mean, median and mode are equal. Scott, D. (2009) tells histogram as a bar chart that shows frequency distribution of a variable in graphical form.
Project Plan
We have made the Gantt chart in excel by scheduling various tasks of project with their start date and the duration. The y-axis of the chart shows the set of tasks needed to complete the project and the x-axis show the dates on which tasks are started and completed.
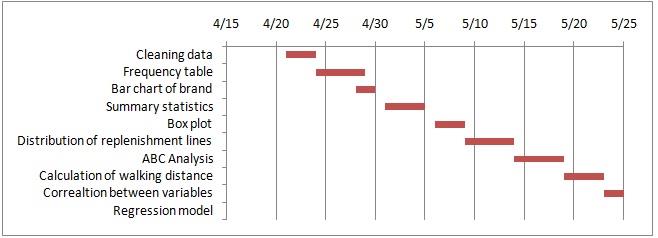
Gantt Chart Showing the Project Plan
DO YOU WANT TO EXCEL IN BUSS-B 2012 RESEARCH METHODS, DATA ANALYTICS AND PROJECT PLANNING ASSIGNMENT - ORDER AT EXPERTSMINDS!
Part 1: Data analysis and cleaning of data sets
a) Clean the data
b) Make a frequency table of the brand
c) Make a bar chart for the absolute frequency of the brand.
d) Make a classified frequency table of the weight per article.
e) Make a histogram of the absolute frequency of the number of weight per article.
f) Determine mode, median, and average of the number of sold pieces per year.
g) Determine the range of the number of pieces per pallet.
h) Make a box plot of the number of sold pieces per year and the weight per article (use the unfiltered data set here). Determine the extremes.
i) Check whether the number of replenishment lines per day is normally distribute
Task 1
This part of the task requires analysis of the dataset of the logistic inc. which is collected from different sources. Dataset is contaminated as it contains a lot of irrelevant values. First , we need to clean the dataset using a definite criteria. We have filtered the data on the basis of following criteria:-
a) The weight per piece can not be zero but dataset contains a lot of data entries in which weight per piece is zero so, we have filtered those entries from the dataset
b) The number of pieces sold should be a integer. It cannot be in decimal. So, we have filtered all the entries that contain a decimal value for the number of pieces sold.
c) Also the number of pieces cannot be a negative number. It should be a positive number. So, we have filtered all those entries which contain negative value for number of pieces sold.
d) The number of pieces sold column can not contain a entry in the form of date format. So, in the filtered dataset we have removed all the entries which contain the value in the format of date.
e) The dataset also contains one outlier in the column number of pieces sold which is much greater than other values . So, we have removed that value so that our analysis do not get ruined due to that outlier.
We had the sample size of 150 for our initial dataset but after filtering the data on the basis of above criteria we are left with only sample size of 122.
We have the following dataset after filtering. So, we have filtered 81.33% of the dataset.
| Article number |
Brand |
Weight per piece (kg) |
# of sold pieces per year |
Number of replenishment lines per day |
# of pieces per pallet |
| 3B4839015A_V |
Ford |
15.7 |
1173 |
3 |
30 |
| 06A115561_V |
Fiat |
8.2 |
1034 |
1 |
60 |
| 6X1837013A_V |
Fiat |
15.6 |
1022 |
3 |
30 |
| 3B1857521_V |
Ford |
16 |
410 |
3 |
30 |
| 048109243A_V |
Ford |
26.7 |
208 |
2 |
20 |
| 3B0953235B 01C_V |
Kia |
26.7 |
134 |
1 |
20 |
| 2D0837249C_V |
Audi |
6.8 |
92 |
4 |
70 |
| 8A0807346C 01C_V |
Kia |
14.4 |
132 |
1 |
30 |
| 1J1959565E 01C_V |
Audi |
8.7 |
178 |
4 |
60 |
| 4B0121101E_V |
Audi |
12.4 |
68 |
3 |
40 |
| N 10112603_V |
Kia |
4.5 |
2026 |
1 |
110 |
| N 0138493_V |
Audi |
14.3 |
6136 |
2 |
30 |
| 191853733A_V |
Audi |
15.9 |
3672 |
5 |
30 |
| 357853586D_V |
Ford |
15.4 |
3196 |
2 |
30 |
| N 90634901_V |
Kia |
15.1 |
4653 |
2 |
30 |
| 811807577C_V |
Audi |
13.8 |
2044 |
1 |
40 |
| 028129589B_V |
Audi |
0.8 |
2833 |
5 |
630 |
| 701867299 1YX_V |
Audi |
7 |
5194 |
4 |
70 |
| N 90085001_V |
Ford |
9 |
3309 |
1 |
60 |
| 028103533_V |
Audi |
1.8 |
3548 |
2 |
280 |
| 1H0853586_V |
Audi |
9.7 |
4519 |
3 |
50 |
| 028103532A_V |
Kia |
23.6 |
3332 |
2 |
200 |
| N 90074401_V |
Audi |
6 |
1092 |
0 |
80 |
| 161867299 01C_V |
Audi |
4.9 |
1830 |
1 |
100 |
| N 0147392_V |
Kia |
14.5 |
1119 |
1 |
30 |
| N 0241222_V |
Audi |
0.9 |
982 |
4 |
560 |
| N 0138494_V |
Kia |
6.7 |
1010 |
1 |
70 |
| 893823740_V |
Kia |
15 |
1509 |
4 |
30 |
| N 90335004_V |
Audi |
12 |
2656 |
4 |
40 |
| N 0177512_V |
Audi |
6 |
2180 |
2 |
80 |
| 893919040A_V |
Kia |
12.9 |
1588 |
1 |
40 |
| N 90775001_V |
Audi |
7.9 |
888 |
4 |
60 |
| 8D0805960_V |
Audi |
1.9 |
931 |
1 |
260 |
| 028010227E_V |
Fiat |
11 |
1177 |
2 |
50 |
| N 90200201_V |
Kia |
12.3 |
1483 |
0 |
40 |
| N 0438541_V |
Audi |
2 |
3493 |
2 |
250 |
| N 0177192_V |
Fiat |
5.1 |
860 |
3 |
100 |
| 357837242_V |
Audi |
16.7 |
406 |
3 |
30 |
| N 0177185_V |
Audi |
9.9 |
2775 |
1 |
50 |
| 3B0868243_V |
Ford |
12.3 |
1568 |
3 |
40 |
| N 10209005_V |
Ford |
12.6 |
838 |
2 |
40 |
| 701853585_V |
Audi |
14.7 |
1164 |
4 |
30 |
| N 10083401_V |
Audi |
1 |
5550 |
4 |
500 |
| N 10261503_V |
Fiat |
23.9 |
435 |
2 |
20 |
| N 90206103_V |
Ford |
4.4 |
2403 |
2 |
110 |
| N 90329205_V |
Ford |
0.4 |
475 |
2 |
1250 |
| D 00950025_V |
Audi |
30.7 |
3788 |
3 |
20 |
| N 10209603_V |
Audi |
6.9 |
1939 |
5 |
70 |
| N 01781364_V |
Audi |
23.8 |
372 |
2 |
20 |
| N 90355404_V |
Audi |
27.5 |
250 |
2 |
20 |
| N 0102478_V |
Audi |
14.2 |
420 |
2 |
40 |
| 801867299 01C_V |
Audi |
14.4 |
553 |
5 |
30 |
| 037121687_V |
Kia |
362 |
726 |
2 |
0 |
| 101000036AC_V |
Audi |
7.6 |
1344 |
0 |
70 |
| N 90833801_V |
Audi |
4.2 |
777 |
1 |
120 |
| N 10013401_V |
Audi |
2.2 |
1271 |
1 |
230 |
| N 90348701_V |
Audi |
10.7 |
384 |
3 |
50 |
| N 0177612_V |
Audi |
6.1 |
1752 |
4 |
80 |
| N 10101001_V |
Ford |
7.7 |
288 |
1 |
60 |
| 059121119_V |
Audi |
7.1 |
863 |
4 |
70 |
| N 90288901_V |
Fiat |
4.8 |
1037 |
2 |
100 |
| 053103663_V |
Audi |
3.3 |
904 |
2 |
150 |
| N 90787802_V |
Audi |
5.6 |
477 |
4 |
90 |
| 034133557E_V |
Audi |
5 |
565 |
4 |
100 |
| 155853585_V |
Ford |
12.7 |
739 |
1 |
40 |
| N 10081101_V |
Audi |
12 |
436 |
1 |
40 |
| N 90592702_V |
Audi |
2 |
530 |
25 |
250 |
| N 90316802_V |
Fiat |
24.1 |
1913 |
3 |
20 |
| N 0177172_V |
Audi |
11.1 |
2375 |
1 |
50 |
| 030905423A_V |
Audi |
11.9 |
918 |
4 |
40 |
| 811807447_V |
Fiat |
5.2 |
823 |
4 |
100 |
| N 10256401_V |
Fiat |
3.9 |
641 |
1 |
130 |
| 357501641B_V |
Audi |
0.9 |
474 |
0 |
560 |
| 443845631A_V |
Audi |
155 |
1329 |
2 |
1 |
| 036035255J_V |
Kia |
7.2 |
1506 |
2 |
70 |
| 7M0867299K_V |
Audi |
1.3 |
649 |
2 |
380 |
| AKL43401925_V |
Audi |
15 |
75 |
2 |
30 |
| N 90353501_V |
Audi |
14.2 |
504 |
1 |
40 |
| N 0438121_V |
Audi |
23.8 |
1593 |
1 |
20 |
| N 90329104_V |
Audi |
15.6 |
550 |
1 |
30 |
| 8A0407181_V |
Ford |
16.2 |
1634 |
4 |
30 |
| 077010138B_V |
Audi |
11.8 |
834 |
4 |
40 |
| 445827589_V |
Fiat |
15.2 |
322 |
1 |
30 |
| 321611939E_V |
Ford |
7.9 |
690 |
2 |
60 |
| 051905207_V |
Fiat |
11.8 |
332 |
0 |
40 |
| 1H0845125_V |
Audi |
9.9 |
418 |
4 |
|
| 030103533C_V |
Audi |
9.8 |
534 |
0 |
50 |
| 191863447_V |
Ford |
13.5 |
299 |
2 |
40 |
| N 10286102_V |
Audi |
9.4 |
512 |
2 |
50 |
| 893407237_V |
Ford |
7.5 |
736 |
4 |
70 |
| 431253149A_V |
Audi |
14.7 |
349 |
1 |
30 |
| 113853585C_V |
Audi |
22.4 |
789 |
2 |
20 |
| 191867199 E91_V |
Ford |
14.7 |
366 |
2 |
30 |
| 052905225C_V |
Ford |
2.1 |
642 |
2 |
240 |
| 6X0955425B_V |
Kia |
8.5 |
959 |
4 |
60 |
| 191201511A_V |
Audi |
0.9 |
208 |
3 |
560 |
| 191881213 909_V |
Fiat |
2.9 |
447 |
2 |
170 |
| 101000033AA_V |
Audi |
3.8 |
1967 |
2 |
130 |
| 311881247_V |
Audi |
14.1 |
834 |
0 |
40 |
| 357867646_V |
Audi |
4.4 |
278 |
2 |
110 |
| 893253147F_V |
Audi |
9.4 |
400 |
1 |
50 |
| 3B0839723_V |
Fiat |
16.8 |
1432 |
4 |
30 |
| 1H0937530_V |
Audi |
14.5 |
291 |
5 |
30 |
| N 0177622_V |
Audi |
9.9 |
338 |
1 |
50 |
| N 0147263_V |
Audi |
6.5 |
253 |
0 |
80 |
| 3A0611053_V |
Ford |
20.7 |
225 |
2 |
20 |
| N 10229901_V |
Kia |
17.1 |
197 |
2 |
30 |
| N 90577101_V |
Kia |
16.7 |
288 |
2 |
30 |
| 3A0853600 EPG_V |
Fiat |
16.4 |
727 |
1 |
30 |
| 191853615A_V |
Audi |
12.4 |
1210 |
2 |
40 |
| 893947565A_V |
Audi |
15.9 |
463 |
2 |
30 |
| 1H0819055B 01C_V |
Fiat |
7.3 |
319 |
4 |
70 |
| N 90426401_V |
Audi |
12.6 |
707 |
0 |
40 |
| 038010241_V |
Audi |
9.9 |
328 |
1 |
50 |
| ZA 000412 ISO_V |
Fiat |
3.7 |
868 |
2 |
140 |
| 1H0611053A_V |
Fiat |
16.3 |
335 |
4 |
30 |
| 1H0837237D_V |
Ford |
11.7 |
542 |
2 |
40 |
| 1H0837229B_V |
Fiat |
14.9 |
245 |
2 |
30 |
| N 90821401_V |
Audi |
7.8 |
897 |
3 |
60 |
| N 90136802_V |
Audi |
8.4 |
204 |
0 |
60 |
| 8D0845237_V |
Kia |
4.8 |
221 |
2 |
100 |
| N 10299501_V |
Fiat |
24 |
194 |
2 |
20 |
EXPERTSMINDS.COM ACCEPTS INSTANT AND SHORT DEADLINES ORDER FOR BUSS-B 2012 RESEARCH METHODS, DATA ANALYTICS AND PROJECT PLANNING ASSIGNMENT - ORDER TODAY FOR EXCELLENCE!
To make the frequency table of brand we have used pivot for brand column of the table. We have used count function in the pivot table to make the frequency table. After calculating the frequency of each brand we have calculated cumulative frequency by adding the values contained in the frequency table .Then, we have calculated the relative frequency by dividing the respective of each brand with the total frequency.
We have got the following table:-
|
Brand
|
Frequency
|
Commulative Frequency
|
Relative Frequency
|
Commulative Relative Frequency
|
|
Audi
|
68
|
68
|
56%
|
56%
|
|
Fiat
|
19
|
87
|
16%
|
72%
|
|
Ford
|
19
|
106
|
16%
|
87%
|
|
Kia
|
16
|
122
|
13%
|
100%
|
|
Grand Total
|
122
|
|
|
|
To make the classified frequency table for weight per article we have used the columns brand and the weight per article. In the pivot table we have used the sum function to calculate weight for each brand.
So, we have got the following table:-
|
Brand
|
Sum of Weight per piece (kg)
|
|
Audi
|
815.7
|
|
Fiat
|
231.1
|
|
Ford
|
227.2
|
|
Kia
|
562
|
Now, we have used mean, median and mode functions of excel to determine the mean, median and mode of the number of pieces sold per year and we have got following results.
|
Summary
|
Number of pieces sold per year
|
|
Mean
|
1179.70492
|
|
Median
|
783
|
|
Mode
|
208
|
To determine the range of number of pieces per pallet we have subtracted the highest value of number of pieces per pallet and lowest value of number of pieces per pallet. We have got the underlying result.
To plot the box plot for number of pieces sold per year and weight per article we have found the maximum value of number of pieces sold per year and weight per article, minimum of number of pieces sold per year and weight per article and median of number of pieces sold and weight per article and first and third quartile of number of pieces sold per year and weight per article. Then , we have plotted bar chart for both the columns and after that we stacked the columns and plotted error lines to get the box plots.
|
Box Plot for number of sold pieces per year
|
|
Max
|
6136
|
|
|
Q1
|
388
|
|
|
Median
|
783
|
|
|
Q3
|
1500.25
|
|
|
Min
|
68
|
|
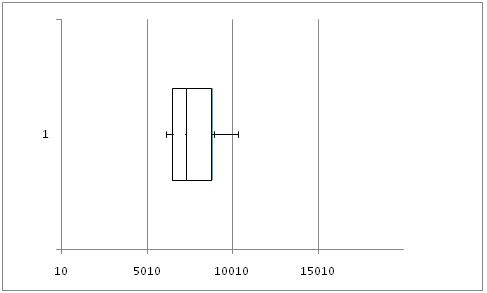
Box Plot for number of pieces sold per year
Weight Per article
|
Max
|
362
|
|
Q1
|
6.025
|
|
Median
|
11.05
|
|
Q3
|
15
|
|
Min
|
0.4
|
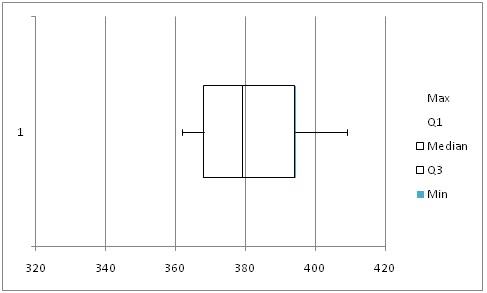
Box plot for weight per article
We have plotted histogram to know whether number of replenishment per day is normally distributed or not. From the shapes of the histogram we can conclude that this variable is not normally distributed
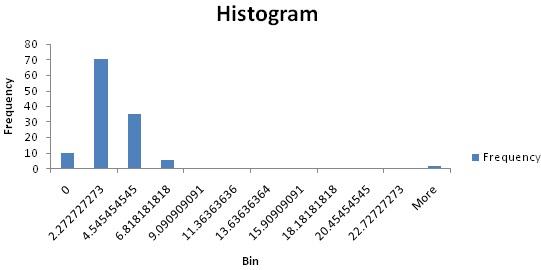
Histogram of number of replenishment lines per day
GETTING STUCK WITH SIMILAR BUSS-B 2012 RESEARCH METHODS, DATA ANALYTICS AND PROJECT PLANNING ASSIGNMENT? ENROL WITH EXPERTSMINDS'S BUSS-B 2012 RESEARCH METHODS, DATA ANALYTICS AND PROJECT PLANNING ASSIGNMENT HELP SERVICES AND GET DISTRESSED WITH YOUR ASSIGNMENT WORRIES!
Part 2: Order profiles and walking distances in a warehouse
a) Make a graph showing the ABC-analysis for the articles of Logistat Inc.
b) determine the number and percentage of SKUs, the number, and percentage of order lines and the number and percentage of used storage locations
c) What is the average number of order lines per order?
Task 2
We have found the number of order lines by aggregating the data of article and the sales file , then , we have calculated number the percentage of SKU as well as number and percentage of order lines. Then, we have assigned the suitable group to each article and calculated number of locations and walking distance in the warehouse. We have also plotted graphs to show relationship between order lines and the SKU.
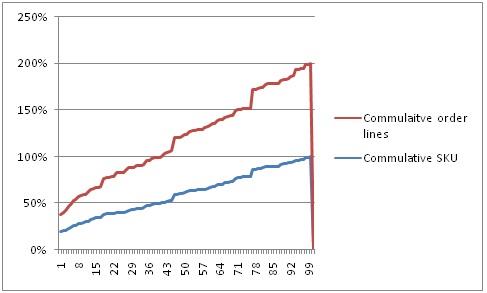
Graph showing Commulative order lines and Commulative SKU
By classifying each article in different groups we have found the number and percentage of SKU and number and percentage of Order lines.
|
Group
|
Sum of SKU
|
Sum of Percentage SKU
|
Sum of Order lines
|
Sum of Percentage Order lines
|
|
A
|
36.7
|
0.139490688
|
203
|
0.203
|
|
AA
|
176.7
|
0.671607754
|
603
|
0.603
|
|
B
|
49.7
|
0.188901558
|
193
|
0.193
|
|
Grand Total
|
263.1
|
1
|
999
|
0.999
|
Table showing SKU AND order lines per group
| Group |
Average of Locations |
| A |
2 |
| AA |
97 |
| B |
1 |
| C |
0 |
Table showing Average number of location per group
Part 3: Correlation, Regression and Probability Distributions.
a) Discuss relationship (Correlation) between each variable (Order Picking, Packaging and Shipping) with separate tables, graphs and scatterplots.
b) Generate 3 valid Regression Equation for predicting any Emergency Order Variables. Discuss the result with line fit plots, normal probability plot and key outcomes.
c) Predict any 5 set of data using the generated regression equations.
Task 3
We have found the scatter plots using 2 variables at a time and then, we have calculated 3 regression equations using the regression function of data analysis tool of excel. The scatter plots between the various plots shows that there is linear relationship between the variables taken two at a time. We have also found the correlation coefficient between the variables which comes out to be 1 for all variables. There is strong degree of correlation between the variables.
|
|
Orderpicking
|
Packaging
|
Shipping
|
|
Orderpicking
|
1.00
|
|
|
|
Packaging
|
1.00
|
1.00
|
|
|
Shipping
|
1.00
|
1.00
|
1.00
|
Table showing correlation coefficient between different variables
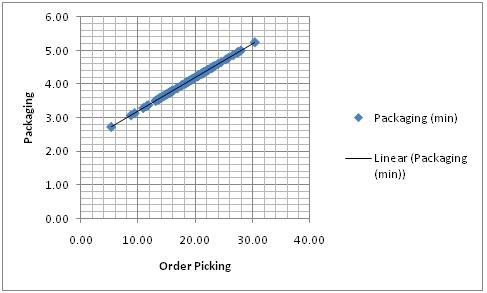
Graph showing correlation between the Order picking and packaging
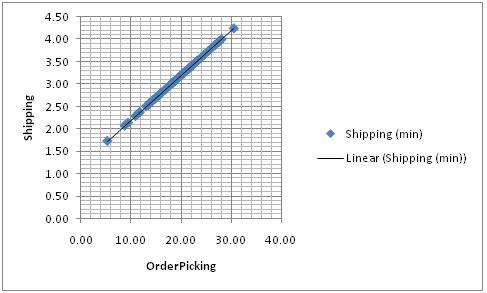
Graph showing Correlation between shipping and order picking
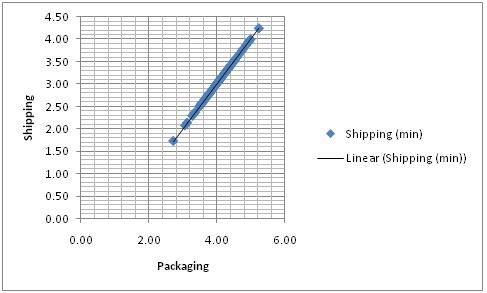
Graph showing Correlation between shipping and order picking
EXPERTSMINDS.COM GIVES ACCOUNTABILITY OF YOUR TIME AND MONEY - AVAIL TOP RESULTS ORIGINATED BUSS-B 2012 RESEARCH METHODS, DATA ANALYTICS AND PROJECT PLANNING ASSIGNMENT HELP SERVICES AT BEST RATES!
Regression equation
We have found three regression for emergency orders by using 2 variables at a time using regression function of XLSTAT.
First Regression Equation
Order picking=-12+0*Packing+10*shipping
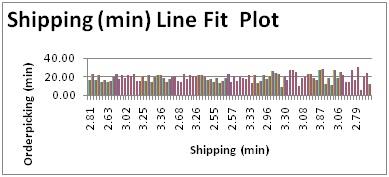
Figure showing Line fit plot between shipping and order picking
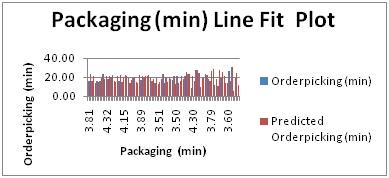
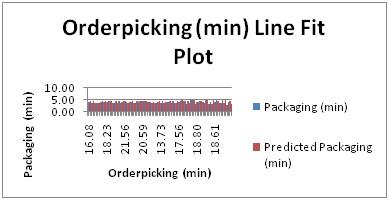
Figure showing line fit plot between Packaging and order picking
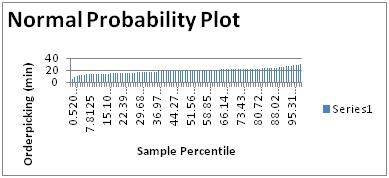
Figure showing normal probability plot for order picking
Second Regression Equation
Packaging=2.2+0*Shipping+0.1*order picking
Graph showing Line fit plot between shipping and packaging
Graph showing Line fit Plot between order picking and packaging
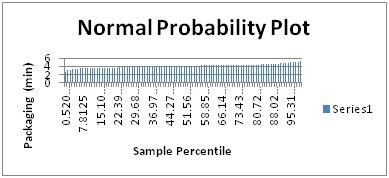
Graph showing normal probability plot for packaging
Third Regression Equation
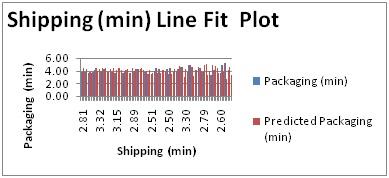
Shipping=1.2+0*Packaging+0.1*order picking
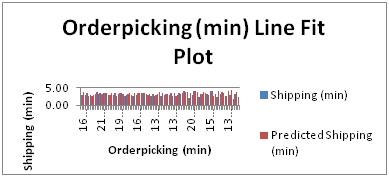
Graph showing line fit plot between shipping and order picking
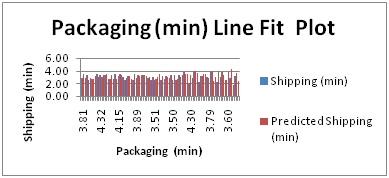
Graph showing line fit plot between shipping and packaging
Graph showing normal probability plot for shipping
Predicting value of shipping using equation Shipping=1.2+0*Packaging+0.1*order picking
|
Packaging (min)
|
Order picking (min)
|
Shipping
|
|
3.81
|
16.08
|
2.81
|
|
4.49
|
22.94
|
3.49
|
|
3.79
|
15.91
|
2.79
|
|
4.32
|
21.19
|
3.32
|
|
3.57
|
13.68
|
2.57
|
Table showing predicted values using equation
Conclusion
We have analyzed the data of the logistics inc. with the help of various statistical functions and techniques such as correlation, regression and scatter plots, box plots, bar charts , histogram and developed a regression model for the company logistics inc. The regression model can provide the value of third variable if 2 variables are known. We have used multiple regression model because we have two independent variables and one dependent variable. We have also found the correlation coefficient between the different variables which comes out to be 1 which shows there is strong correlation between all the variables of the emergency order. Scatter plot also show linear relationship between the variables taken two at a time.
NO PLAGIARISM POLICY - ORDER NEW BUSS-B 2012 RESEARCH METHODS, DATA ANALYTICS AND PROJECT PLANNING ASSIGNMENT & GET WELL WRITTEN SOLUTIONS DOCUMENTS WITH FREE TURNTIN REPORT!
Get our Middle East College Assignment Help services for below mentioned courses like:-
- BUSS 10003 Fundamentals of Business and Organization Assignment Help
- BUSS 23002 Management Accounting for Business Decisions Assignment Help
- BUSS 20007 Exploring Business Strategy Assignment Help
- BUSS 10005 Managing People Assignment Help
- BUSS 20001 Accounting for Business Assignment Help
- BUSS 23001 Principles of Financial Investment Assignment Help
- BUSS 10004 Marketing Principles and Practice Assignment Help
- BUSS 23003 Banking, Financial Products and Services Assignment Help