ARE YOU LOOKING FOR RELIABLE MAT10251 - STATISTICAL ANALYSIS ASSIGNMENT HELP SERVICES? EXPERTSMINDS.COM IS RIGHT CHOICE AS YOUR STUDY PARTNER!
MAT10251 - Statistical Analysis Assignment - Southern Cross University, Australia
STATISTICAL ANALYSIS PROJECT - Factors influencing price of used cars: This project leads you through a statistical analysis of used car data.
Question 1 - Estimate the population mean price of two and three year old used cars of the make and model for sale in the state specified by your sample.
Answer - The descriptive statistics for the price of cars
|
Price
|
|
Mean
|
16173.21
|
|
Standard Error
|
650.6318
|
|
Median
|
17790
|
|
Mode
|
19990
|
|
Standard Deviation
|
6977.248
|
|
Sample Variance
|
48681993
|
|
Kurtosis
|
-1.09773
|
|
Skewness
|
-0.08654
|
|
Range
|
26000
|
|
Minimum
|
3999
|
|
Maximum
|
29999
|
|
Sum
|
1859919
|
|
Count
|
115
|
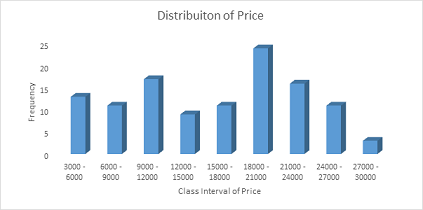
The mean price of two and three year old used cars is $ 16173.21 with a standard deviation of $ 650.63 and the median price of two and three year old used car is $ 17790. The minimum and maximum price of two and three year old used car is $ 3999 and $29999 respectively. Going through the histogram, we see that the distribution of price of two and three year old used cars has longer tail towards the left side of the normal curve, indicating that the distribution is left skewed.
ARE YOU LOOKING FOR RELIABLE MAT10251 - STATISTICAL ANALYSIS ASSIGNMENT HELP SERVICES? EXPERTSMINDS.COM IS RIGHT CHOICE AS YOUR STUDY PARTNER!
Question 2 - Are more than 30% of used cars of the make and model for sale in the state specified by your sample white?
Answer - The frequency distribution of White car is given below
|
White
|
Frequency
|
Percentage
|
|
No
|
84
|
73.04%
|
|
Yes
|
31
|
26.96%
|
|
Total
|
115
|
|
Null Hypothesis: H0: P <= 0.3
That is, not more than 30% of used cars purchased are white cars
Alternate Hypothesis: Ha: P > 0.3
That is, more than 30% of used cars purchased are white cars
Level of Significance:
Let the level of significance be α = 0.05
Test Statistic
The z test statistic
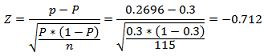
The p - value of z test statistic is 0.7619.
Since the p - value of z test statistic is greater than 0.05, there is no sufficient evidence to reject the null hypothesis at 5% level of significance. Thus, there is no sufficient evidence to conclude that the proportion white car sales is greater than 30%.
SAVE YOUR HIGHER GRADE WITH ACQUIRING MAT10251 - STATISTICAL ANALYSIS ASSIGNMENT HELP & QUALITY HOMEWORK WRITING SERVICES OF EXPERTSMINDS.COM!
Question 3 - Is there a difference in the average price of cars, of the specified make and model for sale in the specified state, for sale privately and by a used car dealer?
Answer - Null Hypothesis: H0: µ1 = µ2
That is, the average price of cars do not differ significantly between private and dealer sale
Alternate Hypothesis: Ha: µ1 ≠ µ2
That is, the average price of cars differ significantly between private and dealer sale
Level of Significance:
Let the level of significance be α = 0.05
Test Statistic
The table given below shows the workings of t test statistic
t-Test: Two-Sample Assuming Equal Variances
|
t-Test: Two-Sample Assuming Equal Variances
|
|
|
Price - Private
|
Price - Dealer
|
|
Mean
|
14948.94
|
17148.80
|
|
Variance
|
44438800.38
|
50642116.39
|
|
Observations
|
51
|
64
|
|
Pooled Variance
|
47897286.29
|
|
|
Hypothesized Mean Difference
|
0
|
|
|
df
|
113
|
|
|
t Stat
|
-1.6934
|
|
|
P(T<=t) one-tail
|
0.0466
|
|
|
t Critical one-tail
|
1.6585
|
|
|
P(T<=t) two-tail
|
0.0931
|
|
|
t Critical two-tail
|
1.9812
|
|
The value of t test statistic is - 1.6934 and its corresponding p - value is 0.0931. Here, we see that the p - value of t test statistic is greater than 0.05, indicating that the average price of cars do not differ significantly between private and dealer sale.
DO YOU WANT TO EXCEL IN MAT10251 - STATISTICAL ANALYSIS ASSIGNMENT? HIRE TRUSTED TUTORS FROM EXPERTSMINDS AND ACHIEVE SUCCESS!
Question 4 - Simple Linear Regression Model: - Calculating the least squares regression line, correlation coefficient and coefficient of determination. Interpreting the gradient and vertical intercept of the simple linear regression equation. Interpreting the correlation coefficient and coefficient of determination. Are these values consistent with your scatter plot?
Dependent Variable: Price
Independent Variable: Odometer (kms)
The regression output is given below
|
SUMMARY OUTPUT
|
|
|
|
|
|
|
|
|
|
|
|
|
|
|
Regression Statistics
|
|
|
|
|
|
|
Multiple R
|
0.846666
|
|
|
|
|
|
|
R Square
|
0.716844
|
|
|
|
|
|
|
Adjusted R Square
|
0.714338
|
|
|
|
|
|
|
Standard Error
|
3729.153
|
|
|
|
|
|
|
Observations
|
115
|
|
|
|
|
|
|
|
|
|
|
|
|
|
ANOVA
|
|
|
|
|
|
|
|
|
df
|
SS
|
MS
|
F
|
Significance F
|
|
|
Regression
|
1
|
3978303334.09
|
3978303334.09
|
286.07
|
0.00
|
|
|
Residual
|
113
|
1571443822.90
|
13906582.50
|
|
|
|
|
Total
|
114
|
5549747156.99
|
|
|
|
|
|
|
|
|
|
|
|
|
|
Coefficients
|
Standard Error
|
t Stat
|
P-value
|
Lower 95%
|
Upper 95%
|
|
Intercept
|
23731.63
|
566.2416837
|
41.91077161
|
1.08E-70
|
22609.8
|
24853.45
|
|
Odometer (kms)
|
-0.10397
|
0.006146971
|
-16.91370449
|
9.65E-33
|
-0.116146
|
-0.09179
|
The regression equation is
Price = 23731.63 - 0.104 * Odometer
The coefficient of determination is 0.717, indicating that 71.7% of the variation in price is explained by the regression model and the remaining 28.3% left unexplained.
The p - value of f test statistic to validate the model fit is 0.000 < 0.05, indicating that the estimated regression model is good fit in predicting price.
EXPERTSMINDS.COM ACCEPTS INSTANT AND SHORT DEADLINES ORDER FOR MAT10251 - STATISTICAL ANALYSIS ASSIGNMENT - ORDER TODAY FOR EXCELLENCE!
Question 5 - Multiple Linear Regression Model: Calculating the multiple regression equation, multiple correlation coefficient, and coefficient of multiple determination. Interpreting the values of the multiple regression coefficients. Interpreting the values of the multiple correlation coefficient and coefficient of multiple determination. Compare these values with the corresponding values for the simple linear regression model. Then determine the best model to predict the price of a used car by: Using appropriate tests to determine which independent variables make a significant contribution to the regression model. Give or calculate the simple or multiple regression equation which best fits the data.
Answer - Dependent Variable: Price
Independent Variable: Age, Odometer (kms) and Transmission
The multiple regression output is given below
|
SUMMARY OUTPUT
|
|
|
|
|
|
|
|
|
|
|
|
|
|
Regression Statistics
|
|
|
|
|
|
|
Multiple R
|
0.91
|
|
|
|
|
|
|
R Square
|
0.84
|
|
|
|
|
|
|
Adjusted R Square
|
0.83
|
|
|
|
|
|
|
Standard Error
|
2857.33
|
|
|
|
|
|
|
Observations
|
115.00
|
|
|
|
|
|
|
|
|
|
|
|
|
|
ANOVA
|
|
|
|
|
|
|
|
|
df
|
SS
|
MS
|
F
|
Significance F
|
|
|
Regression
|
3.00
|
4643503522.54
|
1547834507.51
|
189.58
|
0.00
|
|
|
Residual
|
111.00
|
906243634.45
|
8164357.07
|
|
|
|
|
Total
|
114.00
|
5549747156.99
|
|
|
|
|
|
|
|
|
|
|
|
|
|
Coefficients
|
Standard Error
|
t Stat
|
P-value
|
Lower 95%
|
Upper 95%
|
|
Intercept
|
24106.70
|
636.73
|
37.86
|
0.00
|
22844.97
|
25368.43
|
|
Age
|
-990.31
|
117.07
|
-8.46
|
0.00
|
-1222.30
|
-758.32
|
|
Odometer (kms)
|
-0.04
|
0.01
|
-4.62
|
0.00
|
-0.06
|
-0.02
|
|
Transmission
|
1813.85
|
560.96
|
3.23
|
0.00
|
702.27
|
2925.43
|
The regression equation is
Price = 24106.7 - 990.31 * Age - 0.04 * Odometer + 1813.85 * Transmission
The coefficient of determination is 0.84, indicating that 84% of the variation in price is explained by the regression model and the remaining 16% left unexplained.
The p - value of f test statistic to validate the model fit is 0.000 < 0.05, indicating that the estimated regression model is good fit in predicting price.
NEVER LOSE YOUR CHANCE TO EXCEL IN MAT10251 - STATISTICAL ANALYSIS ASSIGNMENT - HIRE BEST QUALITY TUTOR FOR ASSIGNMENT HELP!
Avail the best Southern Cross University, Australia Assignment Help Services for related units and courses such as:-
- MAT10719 Calculus Assignment Help
- MAT30002 Topology Assignment Help
- MAT30001 Group Theory Assignment Help
- MAT10720 Linear Algebra Assignment Help
- MAT10722 Complex Analysis Assignment Help
- MAT71215 Introductory Algebra and Calculus Assignment Help
- MAT10706 Quantitative Methods with Economics Assignment Help
- MAT83001 Analysis of Multivariate Behavioural Data Assignment Help
- MAT10721 Multivariate Calculus and Differential Equations Assignment Help
- MAT71004 Introduction to Evidence for Health Science Practitioners Assignment Help
- MAT82001 Applied Research and Evaluation Methods for Health Sciences Assignment Help
- MAT83002 Applied Research and Evaluation for the Psychological Scientist-Practitioner Assignment Help