ENROL WITH ITECH7407 DATA ANALYTICS ASSIGNMENT HELP AND HOMEWORK WRITING SERVICES OF EXPERTSMINDS.COM AND GET BETTER RESULTS IN ITECH7407 DATA ANALYTICS ASSIGNMENTS!
ITECH7407 Real Time Analytics - Data Analytics Assignment, Federation University, Australia
This is a business analytics project aimed at generating innovative analytics solutions for a Company. The objective is to analyze the given datasets from a relevant firm's perspective in terms of implications and strategies which the chosen company could adopt to improve its functions, resources and processes efficiently and effectively.
Task 1- Background information - Write a description of the selected dataset and project, and its importance for your chosen company. Information must be appropriately referenced.
Task 2- Create Data View/Cube - Data Modelling and Provisioning - Upon selecting the dataset, convert the dataset into HANA data cube/view by following the SAP HANA data modeling and provisioning technique using SAP HANA Web-based development workbench.
Task 3 - Perform Data Mining on data view - For your project, perform the relevant data analysis tasks on data view/cube (created in Task 2) using data mining techniques such as classification/association/time series/clustering and identify the BI reporting solution and/or dashboards you need to develop for the operational manager of the chosen company.
Task 4 - Research - Justify why you chose thee BI reporting solution/dashboards/data mining technique in Task 3 and why those data sets attributes are present and laid out in the fashion you proposed.
Task 5 - Recommendations for CEO - The CEO of the chosen company would like to improve their operations. Based on your BI analysis and the insights gained from your "Dataset" in the lights of analysis performed in previous tasks, make some logical recommendations to the CEO, and justify why/how your proposal could assist in achieving operational/strategic objectives with the help of appropriate references from peer-reviewed sources.
Task 6 - Cover letter - Write a cover letter to the CEO of the chosen firm with the important data insights and recommendations to achieve operational/strategic objectives.
24/7 AVAILABILITY OF TRUSTED ITECH7407 DATA ANALYTICS ASSIGNMENT WRITERS! ORDER ASSIGNMENTS FOR BETTER RESULTS!
Answer - WORLD HEALTH CARE INVESTMENT GOVERNMENT SECTOR INVESTMENT
Introduction
In this assignment we are analysis the health expenditure ratio in current scenario . The expenditure ratio gap is increasing or decreasing from last 10 year of (%of GDP). This is big data ,collected from world bank data. This Big data we gathered from the website is in the format of csv. This assignment shall have discussing about the predictive tool and their usages. The current trends is showing prediction or forecasting about the trends in any sector. The Big data analysis is a helpful for knowing the future trends .Our aim of report is , we use SAP analytical tool for our collected data. . In this article we are predictive World Health Organization Global Health Expenditure and analysis the Current health expenditure In this report. Our analysis showing the trend in health sector
Our report is discussing the information about primary health sector .The primary health sector need more expenditure therefore this will help to improvement of health .Our analysis is mainly focus on government investment is past 10 year as we have 10 year data.
SAP Analytical Tool and Data Model
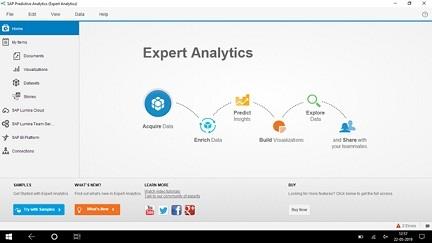
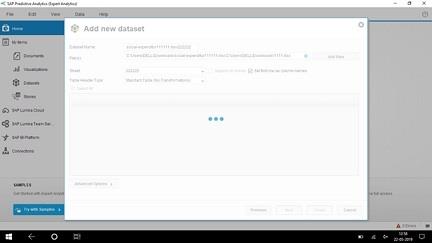
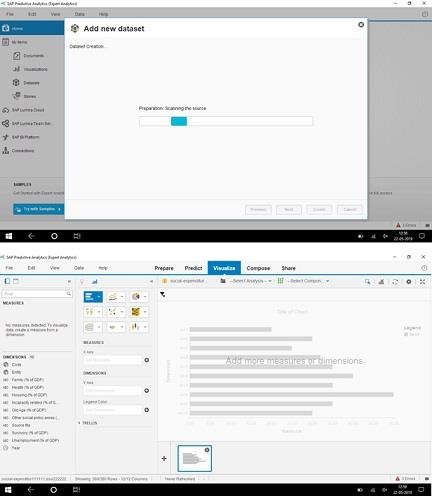
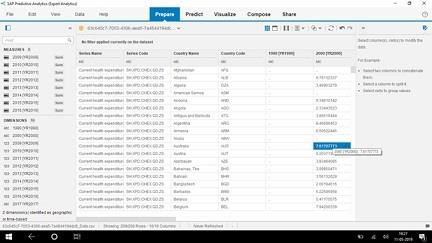
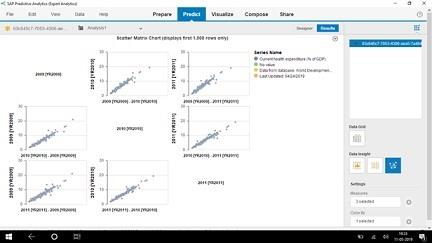
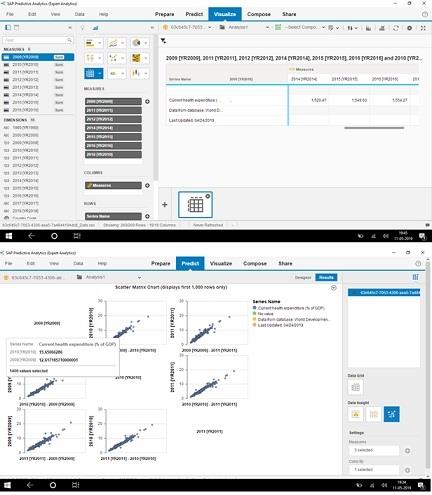
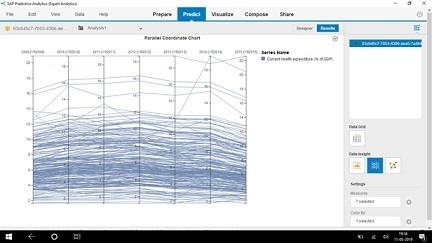
We are using the SAP predictive tool that have basic functionality . The tool is menu driven . The tool having in-built algorithm that will help to analysis the big data . For the SAP tool when we open the tool first window show For the SAP tool when we open the tool first window show the numerous option for the working on Big data we select the expert analysis option . When we select the expert analysis option then a window is come's up that is asking tor loading the Big data . This window show for the Big data numerous type . We select from this window is excel data . According to selection excel data is load and a process is start for cleaning and loading the data . After the loading and cleaning the data a screen come's up that is showing prediction option.
Now this window saying we are ready to prediction on Big data using SAP in -built function.
The window show three option
1. Prepare
2. Predict
3. Visualization
We start with Prepare option fun Big data. Afterward we use Predict option and now we could saw the information using visualization option.
GET ASSURED A++ GRADE IN EACH ITECH7407 DATA ANALYTICS ASSIGNMENT ORDER - ORDER FOR ORIGINALLY WRITTEN SOLUTIONS!
NO PLAGIARISM POLICY - ORDER NEW ITECH7407 DATA ANALYTICS ASSIGNMENT & GET WELL WRITTEN SOLUTIONS DOCUMENTS WITH FREE TURNTIN REPORT!
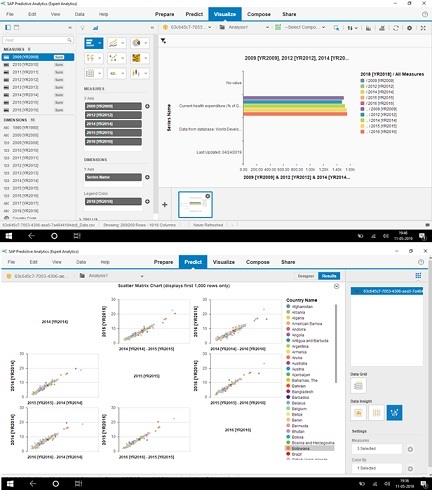
This figure is showing the information year wise XY graph .We use SAP BI tool and extract the data year for each country and that is given below:
|
LOCATION
|
TIME
|
Value
|
|
AUS
|
2014
|
4300.383
|
|
AUT
|
2014
|
5059.599
|
|
BEL
|
2014
|
4612.01
|
|
CAN
|
2014
|
4538.199
|
|
CZE
|
2014
|
2469.139
|
|
DNK
|
2014
|
4872.49
|
|
FIN
|
2014
|
3931.38
|
|
FRA
|
2014
|
4666.074
|
|
DEU
|
2014
|
5160.105
|
|
GRC
|
2014
|
2133.652
|
|
HUN
|
2014
|
1810.395
|
|
ISL
|
2014
|
3784.891
|
|
IRL
|
2014
|
4939.523
|
|
ITA
|
2014
|
3250.499
|
|
JPN
|
2014
|
4245.202
|
|
KOR
|
2014
|
2290.805
|
|
LUX
|
2014
|
6689.863
|
|
MEX
|
2014
|
1020.82
|
|
NLD
|
2014
|
5277.928
|
|
NZL
|
2014
|
3511.49
|
|
NOR
|
2014
|
6157.628
|
|
POL
|
2014
|
1599.739
|
|
PRT
|
2014
|
2593.617
|
|
SVK
|
2014
|
1998.395
|
|
ESP
|
2014
|
3042.008
|
|
SWE
|
2014
|
5183.385
|
|
CHE
|
2014
|
7115.238
|
|
TUR
|
2014
|
1042.59
|
|
GBR
|
2014
|
3958.337
|
|
USA
|
2014
|
9027.752
|
|
CHL
|
2014
|
1731.705
|
|
EST
|
2014
|
1771.668
|
|
ISR
|
2014
|
2457.971
|
|
SVN
|
2014
|
2624.563
|
|
BRA
|
2014
|
1374.997
|
|
CHN
|
2014
|
658.039
|
|
COL
|
2014
|
859.99
|
|
IND
|
2014
|
205.885
|
|
IDN
|
2014
|
366.647
|
|
LVA
|
2014
|
1301.142
|
|
LTU
|
2014
|
1745.527
|
|
RUS
|
2014
|
1355.052
|
|
ZAF
|
2014
|
1044.913
|
|
CRI
|
2014
|
1188.894
|
|
AUS
|
2014
|
2896.647
|
|
AUS
|
2014
|
1403.736
|
|
AUT
|
2014
|
3744.639
|
|
AUT
|
2014
|
1314.96
|
|
BEL
|
2014
|
3607.855
|
|
BEL
|
2014
|
1004.155
|
|
CAN
|
2014
|
3193.934
|
|
CAN
|
2014
|
1344.264
|
|
CZE
|
2014
|
2041.65
|
|
CZE
|
2014
|
427.489
|
|
DNK
|
2014
|
4102.126
|
|
DNK
|
2014
|
770.364
|
|
FIN
|
2014
|
2943.886
|
|
FIN
|
2014
|
987.494
|
|
FRA
|
2014
|
3568.978
|
|
FRA
|
2014
|
1097.096
|
|
DEU
|
2014
|
4354.249
|
|
DEU
|
2014
|
805.856
|
|
GRC
|
2014
|
1241.902
|
|
GRC
|
2014
|
864.325
|
|
HUN
|
2014
|
1214.74
|
|
HUN
|
2014
|
595.655
|
|
ISL
|
2014
|
3046.815
|
|
ISL
|
2014
|
738.076
|
|
IRL
|
2014
|
3476.796
|
|
IRL
|
2014
|
1462.727
|
|
ITA
|
2014
|
2458.859
|
|
ITA
|
2014
|
791.641
|
|
JPN
|
2014
|
3570.973
|
|
JPN
|
2014
|
674.229
|
|
KOR
|
2014
|
1345.949
|
|
KOR
|
2014
|
944.856
|
|
LUX
|
2014
|
5505.895
|
|
LUX
|
2014
|
1104.998
|
|
MEX
|
2014
|
528.706
|
|
MEX
|
2014
|
492.114
|
|
NLD
|
2014
|
4257.517
|
|
NLD
|
2014
|
1020.412
|
|
NZL
|
2014
|
2793.877
|
|
NZL
|
2014
|
717.614
|
|
NOR
|
2014
|
5251.776
|
|
NOR
|
2014
|
905.853
|
|
POL
|
2014
|
1130.359
|
|
POL
|
2014
|
469.379
|
|
PRT
|
2014
|
1713.921
|
|
PRT
|
2014
|
879.697
|
|
SVK
|
2014
|
1603.258
|
|
SVK
|
2014
|
395.138
|
|
ESP
|
2014
|
2141.562
|
|
ESP
|
2014
|
900.446
|
|
SWE
|
2014
|
4321.193
|
|
SWE
|
2014
|
862.192
|
|
CHE
|
2014
|
4498.989
|
|
CHE
|
2014
|
2616.25
|
|
TUR
|
2014
|
809.103
|
|
TUR
|
2014
|
233.486
|
|
GBR
|
2014
|
3152.497
|
|
GBR
|
2014
|
805.84
|
|
USA
|
2014
|
7345.899
|
|
USA
|
2014
|
1681.853
|
|
BRA
|
2014
|
610.597
|
|
BRA
|
2014
|
764.4
|
|
CHL
|
2014
|
1045.16
|
|
CHL
|
2014
|
686.546
|
|
CHN
|
2014
|
380.868
|
|
CHN
|
2014
|
258.05
|
|
COL
|
2014
|
623.106
|
|
COL
|
2014
|
236.884
|
|
CRI
|
2014
|
868.611
|
|
CRI
|
2014
|
320.283
|
|
EST
|
2014
|
1340.783
|
|
EST
|
2014
|
430.165
|
|
IND
|
2014
|
47.166
|
|
IND
|
2014
|
158.719
|
|
IDN
|
2014
|
143.58
|
|
IDN
|
2014
|
220.041
|
|
ISR
|
2014
|
1554.195
|
|
ISR
|
2014
|
872.516
|
|
LVA
|
2014
|
776.422
|
|
LVA
|
2014
|
524.72
|
|
LTU
|
2014
|
1179.29
|
|
LTU
|
2014
|
565.328
|
|
RUS
|
2014
|
837.24
|
|
RUS
|
2014
|
517.812
|
|
SVN
|
2014
|
1866.426
|
|
SVN
|
2014
|
758.137
|
|
ZAF
|
2014
|
449.03
|
|
ZAF
|
2014
|
595.882
|
|
AUS
|
2015
|
4413.979
|
|
AUT
|
2015
|
5159.345
|
|
BEL
|
2015
|
4589.464
|
|
CAN
|
2015
|
4632.837
|
|
CZE
|
2015
|
2392.635
|
|
DNK
|
2015
|
5000.768
|
|
FIN
|
2015
|
4098.952
|
|
FRA
|
2015
|
4656.575
|
|
DEU
|
2015
|
5296.994
|
|
GRC
|
2015
|
2187.656
|
|
HUN
|
2015
|
1861.888
|
|
ISL
|
2015
|
3964.208
|
|
IRL
|
2015
|
5106.253
|
|
ITA
|
2015
|
3292.267
|
|
JPN
|
2015
|
4428.349
|
|
KOR
|
2015
|
2481.587
|
|
LUX
|
2015
|
6496.939
|
|
MEX
|
2015
|
1037.424
|
|
NLD
|
2015
|
5148.399
|
|
NZL
|
2015
|
3523.953
|
|
NOR
|
2015
|
6239.435
|
|
POL
|
2015
|
1687.009
|
|
PRT
|
2015
|
2649.599
|
|
SVK
|
2015
|
2027.438
|
|
ESP
|
2015
|
3175.457
|
|
SWE
|
2015
|
5271.934
|
|
CHE
|
2015
|
7570.232
|
|
TUR
|
2015
|
1028.911
|
|
GBR
|
2015
|
4071.806
|
|
USA
|
2015
|
9491.4
|
|
CHL
|
2015
|
1803.128
|
|
EST
|
2015
|
1859.566
|
|
ISR
|
2015
|
2646.915
|
|
SVN
|
2015
|
2675.356
|
|
BRA
|
2015
|
1401.847
|
|
CHN
|
2015
|
762.113
|
|
COL
|
2015
|
856.457
|
|
IND
|
2015
|
238.098
|
|
IDN
|
2015
|
382.844
|
|
LVA
|
2015
|
1399.678
|
|
LTU
|
2015
|
1864.126
|
|
RUS
|
2015
|
1305.409
|
|
ZAF
|
2015
|
1090.164
|
|
CRI
|
2015
|
1234.481
|
|
AUS
|
2015
|
3010.696
|
|
AUS
|
2015
|
1403.283
|
|
AUT
|
2015
|
3824.239
|
|
AUT
|
2015
|
1335.106
|
|
BEL
|
2015
|
3598.054
|
|
BEL
|
2015
|
991.411
|
|
CAN
|
2015
|
3267.052
|
|
CAN
|
2015
|
1365.785
|
|
CZE
|
2015
|
1996.719
|
|
CZE
|
2015
|
395.915
|
|
DNK
|
2015
|
4209.806
|
|
DNK
|
2015
|
790.962
|
|
FIN
|
2015
|
3070.813
|
|
FIN
|
2015
|
1028.139
|
|
FRA
|
2015
|
3566.119
|
|
FRA
|
2015
|
1090.456
|
|
DEU
|
2015
|
4465.266
|
|
DEU
|
2015
|
831.728
|
|
GRC
|
2015
|
1274.979
|
|
GRC
|
2015
|
877.298
|
|
HUN
|
2015
|
1244.876
|
|
HUN
|
2015
|
617.012
|
|
ISL
|
2015
|
3203.972
|
|
ISL
|
2015
|
760.236
|
|
IRL
|
2015
|
3635.388
|
|
IRL
|
2015
|
1470.865
|
|
ITA
|
2015
|
2455.804
|
|
ITA
|
2015
|
836.464
|
|
JPN
|
2015
|
3723.488
|
|
JPN
|
2015
|
704.861
|
|
KOR
|
2015
|
1461.565
|
|
KOR
|
2015
|
1020.022
|
|
LUX
|
2015
|
5312.62
|
|
LUX
|
2015
|
1107.449
|
|
MEX
|
2015
|
541.211
|
|
MEX
|
2015
|
496.214
|
|
NLD
|
2015
|
4171.893
|
|
NLD
|
2015
|
976.506
|
|
NZL
|
2015
|
2783.549
|
|
NZL
|
2015
|
740.405
|
|
NOR
|
2015
|
5335.628
|
|
NOR
|
2015
|
903.807
|
|
POL
|
2015
|
1180.713
|
|
POL
|
2015
|
506.296
|
|
PRT
|
2015
|
1753.137
|
|
PRT
|
2015
|
896.463
|
|
SVK
|
2015
|
1616.195
|
|
SVK
|
2015
|
411.243
|
|
ESP
|
2015
|
2263.563
|
|
ESP
|
2015
|
911.894
|
|
SWE
|
2015
|
4393.487
|
|
SWE
|
2015
|
878.447
|
|
CHE
|
2015
|
4796.262
|
|
CHE
|
2015
|
2773.97
|
|
TUR
|
2015
|
803.928
|
|
TUR
|
2015
|
224.983
|
|
GBR
|
2015
|
3240.206
|
|
GBR
|
2015
|
831.599
|
|
USA
|
2015
|
7778.12
|
|
USA
|
2015
|
1713.28
|
|
BRA
|
2015
|
606.972
|
|
BRA
|
2015
|
794.874
|
|
CHL
|
2015
|
1095.979
|
|
CHL
|
2015
|
707.149
|
|
CHN
|
2015
|
433.046
|
|
CHN
|
2015
|
272.587
|
|
COL
|
2015
|
606.252
|
|
COL
|
2015
|
250.205
|
|
CRI
|
2015
|
925.402
|
|
CRI
|
2015
|
309.079
|
|
EST
|
2015
|
1406.151
|
|
EST
|
2015
|
453.331
|
|
IND
|
2015
|
59.013
|
|
IND
|
2015
|
179.086
|
|
IDN
|
2015
|
123.759
|
|
IDN
|
2015
|
259.085
|
|
ISR
|
2015
|
1659.709
|
|
ISR
|
2015
|
945.56
|
|
LVA
|
2015
|
798.324
|
|
LVA
|
2015
|
601.354
|
|
LTU
|
2015
|
1251.57
|
|
LTU
|
2015
|
611.387
|
|
RUS
|
2015
|
766.517
|
|
RUS
|
2015
|
538.892
|
|
SVN
|
2015
|
1919.384
|
|
SVN
|
2015
|
755.972
|
|
ZAF
|
2015
|
465.581
|
|
ZAF
|
2015
|
624.583
|
|
AUS
|
2016
|
4513.991
|
|
AUT
|
2016
|
5273.243
|
|
BEL
|
2016
|
4659.518
|
|
CAN
|
2016
|
4721.578
|
|
CZE
|
2016
|
2481.697
|
|
DNK
|
2016
|
5074.523
|
|
FIN
|
2016
|
4117.913
|
|
FRA
|
2016
|
4773.039
|
|
DEU
|
2016
|
5451.854
|
|
GRC
|
2016
|
2262.788
|
|
HUN
|
2016
|
1966.456
|
|
ISL
|
2016
|
4207.586
|
|
IRL
|
2016
|
5267.28
|
|
ITA
|
2016
|
3429.458
|
|
JPN
|
2016
|
4585.388
|
|
KOR
|
2016
|
2687.725
|
|
LUX
|
2016
|
6447.728
|
|
MEX
|
2016
|
1020.301
|
|
NLD
|
2016
|
5235.456
|
|
NZL
|
2016
|
3639.448
|
|
NOR
|
2016
|
6175.252
|
|
POL
|
2016
|
1784.262
|
|
PRT
|
2016
|
2782.688
|
|
SVK
|
2016
|
2170.342
|
|
ESP
|
2016
|
3256.72
|
|
SWE
|
2016
|
5347.612
|
|
CHE
|
2016
|
7823.965
|
|
TUR
|
2016
|
1092.466
|
|
GBR
|
2016
|
4164.248
|
|
USA
|
2016
|
9832.317
|
|
CHL
|
2016
|
1892.592
|
|
EST
|
2016
|
1987.951
|
|
ISR
|
2016
|
2725.22
|
|
SVN
|
2016
|
2771.083
|
|
LVA
|
2016
|
1597.334
|
|
LTU
|
2016
|
1992.29
|
|
RUS
|
2016
|
1304.732
|
|
CRI
|
2016
|
1236.798
|
|
AUS
|
2016
|
3083.391
|
|
AUS
|
2016
|
1430.6
|
|
AUT
|
2016
|
3908.287
|
|
AUT
|
2016
|
1364.956
|
|
BEL
|
2016
|
3672.174
|
|
BEL
|
2016
|
987.344
|
|
CAN
|
2016
|
3319.113
|
|
CAN
|
2016
|
1402.465
|
|
CZE
|
2016
|
2034.436
|
|
CZE
|
2016
|
447.261
|
|
DNK
|
2016
|
4268.811
|
|
DNK
|
2016
|
805.712
|
|
FIN
|
2016
|
3066.836
|
|
FIN
|
2016
|
1051.076
|
|
FRA
|
2016
|
3956.65
|
|
FRA
|
2016
|
816.389
|
|
DEU
|
2016
|
4612.3
|
|
DEU
|
2016
|
839.554
|
|
GRC
|
2016
|
1388.143
|
|
GRC
|
2016
|
868.857
|
|
HUN
|
2016
|
1302.6
|
|
HUN
|
2016
|
663.856
|
|
ISL
|
2016
|
3429.607
|
|
ISL
|
2016
|
777.979
|
|
IRL
|
2016
|
3796.125
|
|
IRL
|
2016
|
1471.155
|
|
ITA
|
2016
|
2553.719
|
|
ITA
|
2016
|
875.739
|
|
JPN
|
2016
|
3863.281
|
|
JPN
|
2016
|
722.107
|
|
KOR
|
2016
|
1589.921
|
|
KOR
|
2016
|
1097.804
|
|
LUX
|
2016
|
5218.14
|
|
LUX
|
2016
|
1155.251
|
|
MEX
|
2016
|
533.923
|
|
MEX
|
2016
|
486.378
|
|
NLD
|
2016
|
4239.49
|
|
NLD
|
2016
|
995.966
|
|
NZL
|
2016
|
2862.569
|
|
NZL
|
2016
|
776.878
|
|
NOR
|
2016
|
5257.005
|
|
NOR
|
2016
|
918.247
|
|
POL
|
2016
|
1246.285
|
|
POL
|
2016
|
537.977
|
|
PRT
|
2016
|
1846.427
|
|
PRT
|
2016
|
936.261
|
|
SVK
|
2016
|
1752.635
|
|
SVK
|
2016
|
417.707
|
|
ESP
|
2016
|
2320.021
|
|
ESP
|
2016
|
936.699
|
|
SWE
|
2016
|
4465.547
|
|
SWE
|
2016
|
882.065
|
|
CHE
|
2016
|
4911.814
|
|
CHE
|
2016
|
2912.151
|
|
TUR
|
2016
|
856.955
|
|
TUR
|
2016
|
235.512
|
|
GBR
|
2016
|
3311.805
|
|
GBR
|
2016
|
852.443
|
|
USA
|
2016
|
8047.295
|
|
USA
|
2016
|
1785.022
|
|
CHL
|
2016
|
1152.404
|
|
CHL
|
2016
|
740.187
|
|
CRI
|
2016
|
930.209
|
|
CRI
|
2016
|
306.589
|
|
EST
|
2016
|
1504.012
|
|
EST
|
2016
|
483.902
|
|
ISR
|
2016
|
1703.278
|
|
ISR
|
2016
|
980.267
|
|
LVA
|
2016
|
872.665
|
|
LVA
|
2016
|
724.669
|
|
LTU
|
2016
|
1332.797
|
|
LTU
|
2016
|
659.31
|
|
RUS
|
2016
|
743.045
|
|
RUS
|
2016
|
561.686
|
|
SVN
|
2016
|
2014.024
|
|
SVN
|
2016
|
757.059
|
|
AUS
|
2017
|
4543.085
|
|
AUT
|
2017
|
5439.979
|
|
BEL
|
2017
|
4774.332
|
|
CAN
|
2017
|
4826.316
|
|
CZE
|
2017
|
2616.372
|
|
DNK
|
2017
|
5182.837
|
|
FIN
|
2017
|
4172.592
|
|
FRA
|
2017
|
4902.139
|
|
DEU
|
2017
|
5728.451
|
|
GRC
|
2017
|
2324.839
|
|
HUN
|
2017
|
2044.647
|
|
ISL
|
2017
|
4580.71
|
|
IRL
|
2017
|
5449.367
|
|
ITA
|
2017
|
3541.73
|
|
JPN
|
2017
|
4717.276
|
|
KOR
|
2017
|
2897.052
|
|
LUX
|
2017
|
6474.79
|
|
MEX
|
2017
|
1034.378
|
|
NLD
|
2017
|
5385.699
|
|
NZL
|
2017
|
3682.741
|
|
NOR
|
2017
|
6351.326
|
|
POL
|
2017
|
1955.069
|
|
PRT
|
2017
|
2888.155
|
|
SVK
|
2017
|
2268.915
|
|
ESP
|
2017
|
3370.855
|
|
SWE
|
2017
|
5510.715
|
|
CHE
|
2017
|
8009.167
|
|
TUR
|
2017
|
1193.856
|
|
GBR
|
2017
|
4245.542
|
|
USA
|
2017
|
10209.41
|
|
CHL
|
2017
|
1914.797
|
|
EST
|
2017
|
2125.328
|
|
ISR
|
2017
|
2833.597
|
|
SVN
|
2017
|
2775.482
|
|
LVA
|
2017
|
1722.368
|
|
LTU
|
2017
|
2005.184
|
|
AUS
|
2017
|
3109.495
|
|
AUS
|
2017
|
1433.589
|
|
AUT
|
2017
|
4043.528
|
|
AUT
|
2017
|
1396.451
|
|
BEL
|
2017
|
3760.69
|
|
BEL
|
2017
|
1013.642
|
|
CAN
|
2017
|
3381.998
|
|
CAN
|
2017
|
1444.318
|
|
CZE
|
2017
|
2149.85
|
|
CZE
|
2017
|
466.522
|
|
DNK
|
2017
|
4363.352
|
|
DNK
|
2017
|
819.484
|
|
FIN
|
2017
|
3077.837
|
|
FIN
|
2017
|
1094.755
|
|
FRA
|
2017
|
4068.423
|
|
FRA
|
2017
|
833.716
|
|
DEU
|
2017
|
4869.427
|
|
DEU
|
2017
|
859.024
|
|
GRC
|
2017
|
1423.381
|
|
GRC
|
2017
|
901.458
|
|
HUN
|
2017
|
1365.076
|
|
HUN
|
2017
|
679.571
|
|
ISL
|
2017
|
3758.019
|
|
ISL
|
2017
|
822.691
|
|
IRL
|
2017
|
3954.522
|
|
IRL
|
2017
|
1494.846
|
|
ITA
|
2017
|
2621.956
|
|
ITA
|
2017
|
919.774
|
|
JPN
|
2017
|
3970.575
|
|
JPN
|
2017
|
746.701
|
|
KOR
|
2017
|
1686.738
|
|
KOR
|
2017
|
1210.313
|
|
LUX
|
2017
|
5286.434
|
|
LUX
|
2017
|
1188.356
|
|
MEX
|
2017
|
533.345
|
|
MEX
|
2017
|
501.033
|
|
NLD
|
2017
|
4377.677
|
|
NLD
|
2017
|
1008.021
|
|
NZL
|
2017
|
2894.164
|
|
NZL
|
2017
|
788.577
|
|
NOR
|
2017
|
5398.962
|
|
NOR
|
2017
|
952.365
|
|
POL
|
2017
|
1352.232
|
|
POL
|
2017
|
602.837
|
|
PRT
|
2017
|
1924.844
|
|
PRT
|
2017
|
963.311
|
|
SVK
|
2017
|
1826.88
|
|
SVK
|
2017
|
442.035
|
|
ESP
|
2017
|
2385.688
|
|
ESP
|
2017
|
985.168
|
|
SWE
|
2017
|
4606.429
|
|
SWE
|
2017
|
904.286
|
|
CHE
|
2017
|
5030.365
|
|
CHE
|
2017
|
2978.802
|
|
TUR
|
2017
|
934.229
|
|
TUR
|
2017
|
259.627
|
|
GBR
|
2017
|
3341.448
|
|
GBR
|
2017
|
904.094
|
|
CHL
|
2017
|
1164.379
|
|
CHL
|
2017
|
750.418
|
|
EST
|
2017
|
1616.234
|
|
EST
|
2017
|
509.076
|
|
ISR
|
2017
|
1780.425
|
|
ISR
|
2017
|
1053.173
|
|
LVA
|
2017
|
940.903
|
|
LVA
|
2017
|
781.465
|
|
LTU
|
2017
|
1341.422
|
|
LTU
|
2017
|
663.577
|
|
SVN
|
2017
|
2023.569
|
|
SVN
|
2017
|
751.913
|
ENDLESS SUPPORT IN ITECH7407 DATA ANALYTICS ASSIGNMENTS WRITING SERVICES - YOU GET REVISED OR MODIFIED WORK TILL YOU ARE SATISFIED WITH OUR ITECH7407 DATA ANALYTICS ASSIGNMENT HELP SERVICES!
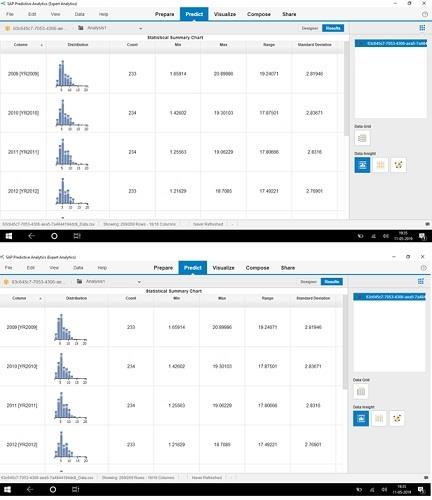
SAP analytical tool is a predictive tool. We are using this tool as this is simple and easy to learn.
The first step is need to load the data in SAP software. There are numerous option in SAP Analytical tool. We are opting the expert analytical option and load the excel data.
We are analysis the world bank data using SAP tool and analysis the world health organization global health expenditure and analysis the current health expenditure. Our gather data require more analysis and statistical work thereafter we will get the result about the current expenditure in health sector . According to data analysis tool observation , 800 million people are forced to spend at least 10% of their income on healthcare, meaning some families must choose between health costs and other essentials such as food and education. We select Prepare option and data will be prepare for the analysis or predict about the data
SAP Analytical Tool Analysis
Our assignment report is based on SAP analytical tool analysis option. According to analysis the global health spending is low and middle income countries is increase up to 6%. The global health spending in high income countries is increasing up to 4%.
This data is showing that now low and middle countries are doing more investment as compare to high level countries. The global data showing now people are very much concern about health issues and spending the money into health sector. Our analysis shown that people are investing money in health from their pocket as compare to government. The private investment is increasing in health sector. This is also showing government is not so much aware about health sector . There is a need to invest more money compare to this current scenario. This scenario is showing that people are expending money on health not and they are not dependent on government investment. The low and middle income countries undergoing the transformation period is about the spending the money in the health.
According to our data analysis U.S. country spends more money health as compare to other wealthy countries
GET READYMADE ITECH7407 DATA ANALYTICS ASSIGNMENT SOLUTIONS - 100% PLAGIARISM FREE WORK DOCUMENT AT NOMINAL CHARGES!
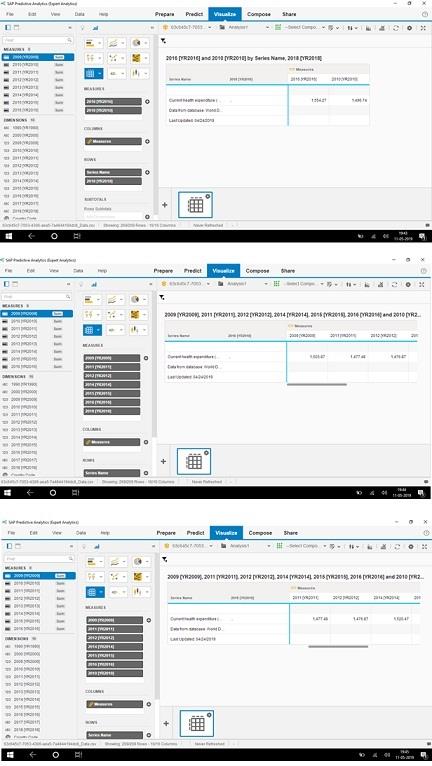
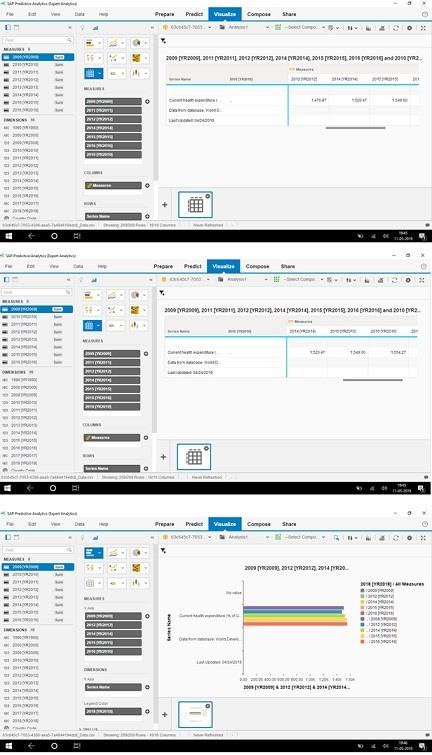
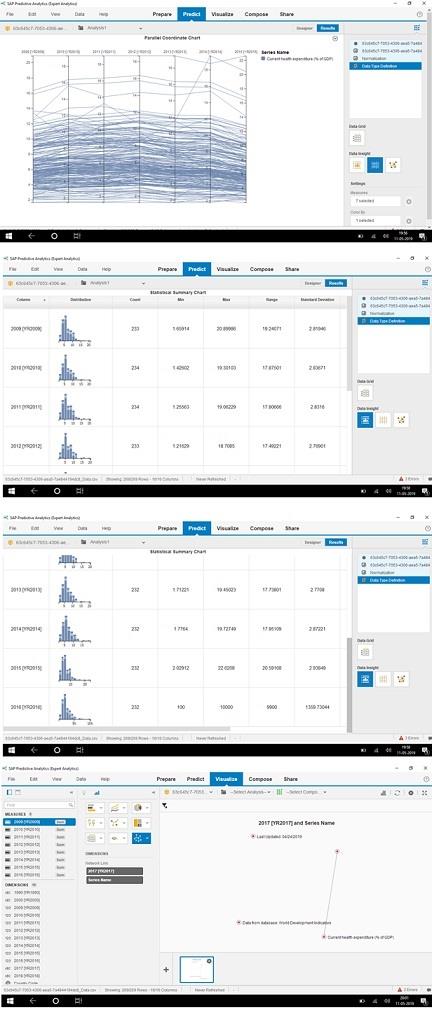
In this report using SAP analytical tool we collected graph using visualisation option about the information of health sector expenditure.
Our analysis shown from last two decades global expenditure is stable in the term of public and private in health care sector. This is slow steady increase growth in health investment sector GDP. This graph is prepare by uses data from the World Health Organisation . Our analysis is showing total healthcare spending around 1.5 percent over last two decades. The World health organization data more than 800 million people are spending the minimum 10% of their income on healthcare. This is showing that people are spending money forcefully on health sector most choose between health cost and other
Our analysis about is health sector investment for last three decades is that is U.S country is that is spending the more money as compare to other countries. The health sector investment GDP ratio is increasing last 10 year, this is reflect by the data in % as health sector increasing from last year is 3.9 to 8.8%..
According to our analysis from last three decades ,U.S spent the 8.5% of GDP that is more from other countries. This data is showing U.S government is aware about the why the investment is require in health sector.
Now these report analysis shown low and middle income countries need to aware about the significance of public spending on health. The health budget must be increase. The government investment in health sector is require for achieving the goal of Sustainable Development.
The low and middle income countries require to invest more money or increase fund for health sector to achieve goal. The Government need to provide to poor people for health subsidy therefore the countries people will be healthy and they will help to countries development.
The government need to emphasis on health sector. The health budget shall include as basic requirement. Hence it will help to poor people .This will help to achieve the health target set by the countries.
MOST RELIABLE AND TRUSTWORTHY ITECH7407 DATA ANALYTICS ASSIGNMENT HELP & HOMEWORK WRITING SERVICES AT YOUR DOORSTEPS!
This chart is showing 2014 is a year where expenditure is low.
The graph is describing about the information according to year wise summary.
The US is spending the 7.2 trillion US$ . This spending is 10% of global GDP health spending. Our analysis is based on tables. These tables are shown the each country's total expenditure on health per capita. We analysis using analytical tool our observation shown U.S health GDP spending ($10,224( is double as per person in comparable countries($5,280.
This observation is showing other wealthy countries not spending like U.S. We are showing the information according to country wise.
a. United States - $10,209
b. Switzerland $8,009
c. Germany $5,728
d. Sweden $5,511
e. Austria $5,440
f. Netherlands $5,386
g. France $4,902
h. Canada $4,826
i. Belgium $4,774
j. Japan $4,717
k. Australia $4,543
l. United Kingdom $4,246
SAVE DISTINCTION MARKS IN EACH ITECH7407 DATA ANALYTICS ASSIGNMENT WHICH IS WRITTEN BY OUR PROFESSIONAL WRITER!
These figures are related to summary chart about total expenditure
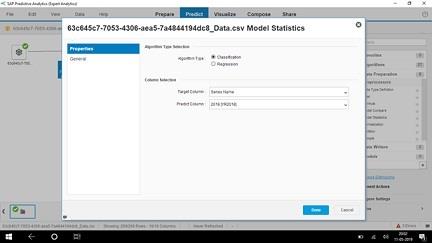
We select the data model and set the alogorithm for prediction using predictive tool
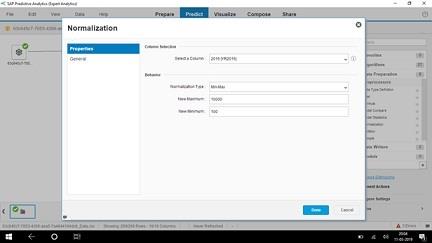
In this analsysis we use the normalization algorithm in this predictive tool
HIRE PROFESSIONAL WRITER FROM EXPERTSMINDS.COM AND GET BEST QUALITY ITECH7407 DATA ANALYTICS ASSIGNMENT HELP AND HOMEWORK WRITING SERVICES!
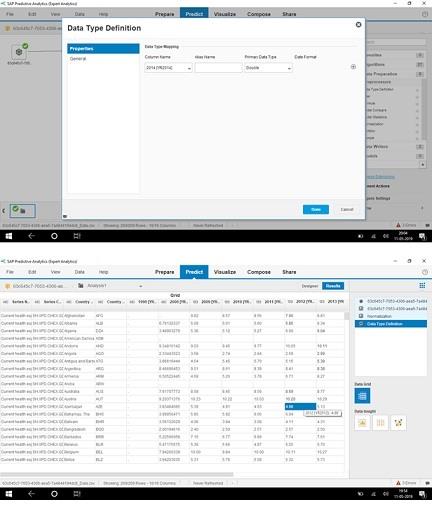
We are giving the Data Type defination
Our analysis using SAP tool shows that U.S expenditure in health sector .We analysis the health budget of all country U.S. spends more on its health care sector
Our analysis shows The U.S. and Switzerland are in the top two spots, spending 17.15% and 12.25% of GDP respectively. Third place goes to France, with 11.45%, followed closely by Germany, with 11.27%.
As per our observation is from last five years largest health spending per capita is U.S.
In the last two decades total aggregate global expenditure on healthcare has been relatively stable, albeit with a slow steady increase. The following visualization uses data from the World Health Organisation (published in the World Development Indicators) to show this. Total healthcare spending as a percent of GDP has seen an overall increase of roughly 1.5 perceptual points over the last two decades, with a relatively constant share of resources coming from the public sector.
WE HELP STUDENTS TO IMPROVE THEIR GRADES! AVAIL TOP QUALITY XXXX ASSIGNMENT HELP AND HOMEWORK WRITING SERVICES AT CHEAPER RATE!
Conclusion
Our report is regarding the health care investment in primary health care sector . Our analysis is shown that low and middle income countries investment is low as compare to high income countries .Since for any country growth require healthy country people so that they will contribute the country development. The lower and middle income country people investment the money in health care sector therefore the invest on food and education is low . According to analysis there is a need to government increase percentage in health care investment
Recommendation Letter
Hon. type Minister's name here
Minister of type department here
type address here
2019
Dear Minister insert Minister's name,
This letter is to request government to take immediate steps towards addressing health sector across Australia. Australia is a rich country, yet there are over 1,100,000 Australian families (10% of Australian families) in health investment stress, paying more than 30 percent of their income on recurrent health costs. Health sector rates are increasing while health of families are effected therefore they investment in health issue According to our analysis in health data sector government investment is low therefore people are investing the health sector from their pocket . The investment on food ,education is low . As analysis is saying Australia investment i
We would also like to bring attention to healthcare services and the need for appropriate funding.
Thank you for considering this request. I would also ask that you respond and indicate the steps that your government will take to address health care in Australia.
Sincerely,
Xxxxx name
NEVER MISS YOUR CHANCE TO EXCEL IN ITECH7407 DATA ANALYTICS ASSIGNMENT! AVAIL AFFORDABLE AND RELIABLE ITECH7407 DATA ANALYTICS ASSIGNMENTS HELP SERVICES OF EXPERTSMINDS.COM!
Hire Expertsminds Tutors and get best Federation University, Australia Assignment Help Service for other courses and units such as:-
- ITECH7400 - IT SERVICE MANAGEMENT AND PROFESSIONAL CULTURE ASSIGNMENT HELP
- ITECH7401 - LEADERSHIP IN IT PROJECT MANAGEMENT ASSIGNMENT HELP
- ITECH7403 - PROJECT ASSIGNMENT HELP
- ITECH7404 - PROJECT 2 (SOFTWARE DEVELOPMENT) ASSIGNMENT HELP
- ITECH7405 - PROJECT 2 (ENTERPRISE SYSTEMS) ASSIGNMENT HELP
- ITECH7406 - BUSINESS INTELLIGENCE AND DATA WAREHOUSING ASSIGNMENT HELP
- ITECH7408 - SOCIAL MEDIA STRATEGY & MANAGEMENT ASSIGNMENT HELP
- ITECH7409 - SOFTWARE TESTING ASSIGNMENT HELP
- ITECH7413 - SUPPLY CHAIN OPERATIONS AND MANAGEMENT ASSIGNMENT HELP
- ITECH7415 - MASTERS PROJECT ASSIGNMENT HELP