Data Mining, Analytics And Visualisation
ARE YOU LOOKING FOR RELIABLE DATA MINING, ANALYTICS AND VISUALISATION ASSIGNMENT HELP SERVICES? EXPERTSMINDS.COM IS RIGHT CHOICE AS YOUR STUDY PARTNER!
Question 1: (a) In order to investigate if a linear relationship between Petrol Price and Crude Oil Price is a reasonable assumption, use Excel's scatterplot option to produce a graph of these two variables. Include the line of best fit (DO NOT INCLUDE R2 - it is not to be discussed here).
Label this graph as EXHIBIT 1 with a relevant title and remember to optimise its presentation via the various formatting options available.
Answer: EXHIBIT 1: Relationship between crude oil price and petrol price
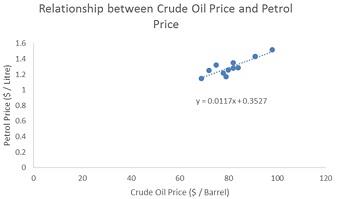
(b) Based ONLY on the scatterplot you produced as Exhibit 1, does a linear relationship seem reasonable? If so, is it a positive or negative slope? Provide evidence for your answer and interpret what this means in context of this question.
Answer: From the above scatter plot, the relationship between crude oil price and petrol points is strong and positively related. The relationship seems to be perfect (as the points move in an increasing order approximately close to the 450 line)
Here, the slope is positive and it clearly states that when there is an increase in the crude oil price, then there is a significant increase in the petrol price too.
EXPERTSMINDS.COM ACCEPTS INSTANT AND SHORT DEADLINES ORDER FOR DATA MINING, ANALYTICS AND VISUALISATION ASSIGNMENT – ORDER TODAY FOR EXCELLENCE!
Question 2: Regardless of your answer in Question One, now assume that a linear relationship is reasonable.
(a) Using the Regression Analysis procedure in Excel, produce a simple linear regression model with Petrol Price as the dependent variable and the following requirements:
- Select 99% Confidence Level in the Output Options.
- Report all values to 4 decimal places where relevant.
- Provide the Summary Output labelled as EXHIBIT 2 with an appropriate title.
Answer: The regression equation to predict petrol price is
Petrol Price = b0 + b1 * Crude Oil Price
The regression output is given below
EXHIBIT 2: Regression model to predict Petrol Price using Crude oil price as Independent variable
Summary Output
|
Regression Statistics
|
|
Multiple R
|
0.8793
|
|
R Square
|
0.7731
|
|
Adjusted R Square
|
0.7504
|
|
Standard Error
|
0.0554
|
|
Observations
|
12
|
ANOVA
|
|
df
|
SS
|
MS
|
F
|
Significance F
|
|
Regression
|
1
|
0.1044
|
0.1044
|
34.0746
|
0.0002
|
|
Residual
|
10
|
0.0307
|
0.0031
|
|
|
|
Total
|
11
|
0.135092
|
|
|
|
|
|
Coefficients
|
Standard Error
|
t Stat
|
P-value
|
Lower 99.0%
|
Upper 99.0%
|
|
Intercept
|
0.3527
|
0.1641
|
2.1495
|
0.0571
|
-0.1673
|
0.8726
|
|
Crude oil price
|
0.0117
|
0.0020
|
5.8373
|
0.0002
|
0.0053
|
0.0180
|
(b) Based on this output, state the equation of this regression model (correct to 4 decimal places), remembering to define the variables.
Answer: The regression equation is
Petrol Price = 0.3527 + 0.0117 * Crude Oil Price
The coefficient of intercept is 0.3527, and it represents the petrol price ($/litre) when the crude oil price is zero
The coefficient of independent variable crude oil price is 0.0117, indicating that the petrol price increases by $ 0.0117 per litre for every one dollar per barrel increase in crude oil price.
ORDER NEW DATA MINING, ANALYTICS AND VISUALISATION ASSIGNMENT & GET 100% ORIGINAL SOLUTION AND QUALITY WRITTEN CONTENTS IN WELL FORMATS AND PROPER REFERENCING!
Question 3: Using a 5% level of significance, determine whether or not this relationship between the price of Petrol and the price of Crude Oil is a statistically significant, linear relationship. Remember to include ALL steps, show ALL working and interpret your conclusion IN CONTEXT of this question.
Answer: In order to determine whether there exists any relationship between Petrol Price and Price of Crude oil, we perform F test for overall significance.
Null Hypothesis: H0: β1 = 0
That is, the model estimated in predicting the petrol price is not good fit
Null Hypothesis: H0: β1 ≠ 0
That is, the model estimated in predicting the petrol price is good fit
Level of Significance
Let the level of significance be α = 0.05
Test Statistic
From the above regression output, we see that
F test statistic = 34.0746
P - Value = 0.0002
Here, the p - value falls well below 0.05, indicating that we can reject the null hypothesis with a significance level of 5%. Therefore, there is sufficient evidence to say that there is a significant relationship between Petrol price and the crude oil price
Question 4: Report to Management
Assuming now that the model you have identified is statistically significant, provide the following in a short report to management:
(a) State and interpret the coefficient of determination for this model.
Answer: The coefficient of determination is 0.7731, indicating that the estimated regression model explains 77.31% of the Petrol price variation while the remaining 22.69% left unexplained
(b) An interpretation of the Y intercept, b0 and the slope coefficient, b1.
Answer: The coefficient of intercept is 0.3527, and it represents the petrol price ($/litre) when the crude oil price is zero. The coefficient of independent variable crude oil price is 0.0117, indicating that the petrol price increases by $ 0.0117 per litre for every one dollar per barrel increase in crude oil price
MOST RELIABLE AND TRUSTWORTHY DATA MINING, ANALYTICS AND VISUALISATION ASSIGNMENT HELP & HOMEWORK WRITING SERVICES AT YOUR DOORSTEPS!
(c) Use the regression model developed in (a) to predict the petrol price if crude oil is $72/barrel.
Answer: The regression equation is
Petrol Price = 0.3527 + 0.0117 * Crude Oil Price
When the Crude oil price = 72, we have
Petrol Price = 0.3527 + 0.0117 * 72 = 1.1922
Thus, the predicted petrol price is $ 1.1922 per litre
(d) Use any relevant information in the data file to comment on this prediction.
Answer: The observed petrol price for crude oil price of $72 per barrel is $ 1.25 per litre and the predicted petrol price is $ 1.1922 per litre. This indicates that there is a difference of $ 0.0578.
(e) Would it be appropriate to use this model to predict the petrol price if crude oil is $200/barrel? Explain.
Answer: No, since the price of crude oil $ 200/barrel was not within the estimated regression model range, it is not appropriate to use this value to predict the petrol price.
(f) From the Summary Output provided in EXHIBIT 2, state and interpret the 99% confidence interval estimate of the population slope beta, correct to 4 decimal places.
Answer: The coefficient of the independent variable Crude Oil price is $ 0.0117 and its 99% confidence interval is ($ 0.0053, $ 0.0180). This indicates that, when we take many samples and that too from the same population, then out of 100 times,, 99 times, the true slope coefficient will fall between $ 0.0053 and $ 0.0180
Question 5: Now, in just a short paragraph, using the findings from this report, answer the original question, "Should we worry about global oil prices?"
Answer: The price of gasoline in Saudi Arabia is $ 0.58 per liter. Also, we see that the average gasoline price is found to be $ 1.1 in the world
The model predicts that the petrol price increases by $ 0.0117 per litre for every one dollar per barrel increase in crude oil price. Thus, it seems to be a worry for the motorists who are going to pay higher prices for their petrol consumption than before. It is estimated that they need to pay 11.7 cents more for each one litre of petrol and it seems to be a disturbing news for them. Since they continuously using vehicles for their daily uses, increase in petrol prices will eventually make them to rethink on their daily budget schedule.
Increase in petrol price, not only affects the motorists, but also, all the consumers either directly or indirectly. The rise in petrol price will eventually increase the transportation costs of the goods, fruits and vegetables and the consumers are at the receiving even. Even an increase of single penny in each of these products will eventually affects their daily routine life. Therefore, the government has to take necessary steps to monitor the petrol process and keep it in a balanced situation.
24/7 AVAILABILITY OF TRUSTED DATA MINING, ANALYTICS AND VISUALISATION ASSIGNMENT WRITERS! ORDER ASSIGNMENTS FOR BETTER RESULTS!