GET ASSURED A++ GRADE IN EACH DATA ANALYST CAPSTONE PROJECT ASSIGNMENT ORDER - ORDER FOR ORIGINALLY WRITTEN SOLUTIONS!
Assignment - Data Analyst Capstone Project
Task - Create and submit a report that documents the analysis you have performed on the competition data and presents your findings and conclusions, with supporting statistics and data visualizations.
Answer -
Executive Summary
The U.S. government assured for mortgage rate spread because the fall of financial crisis in the year of 2008.MBS is a mortgage based securities which is a one of the largest and very famous market in the world. This market can be also referring as liquid based fixed income. In this work we have used a probabilistic machine learning model to classify the data given. The algorithm used for training the government data is Naïve bayes classifier, this classifier works in the basis of Bayes theorem. The classification model of naïve bayes is derived above. The tool used to predict the data is MATLAB 2018a.By using this model we obtained accuracy about 83.8 percentage. This accuracy reveals the performance of our model which is good.
The data used for mortgage rate spread prediction has more number of unique features. The given data consist of 22 columns and 20000 rows. The first column indicates the row id's, the remaining columns are the feature values. So that the given data consists of 21 feature values and 20000 rows of data. Each row has 21 feature values. Each feature has its uniqueness. Let discuss about the features we are using for classification or prediction. The all 21 features are given below.
1. Loan type
Loan type indicates whether the loan granted, applied for, or purchased was conventional, government-guaranteed, or government-insured; available values are:
1 is for Conventional (any loan other than FHA, VA, FSA, or RHS loans)
2 is for FHA-insured (Federal Housing Administration)
3 is for VA-guaranteed (Veterans Administration)
4 is for FSA/RHS (Farm Service Agency or Rural Housing Service)
2. property_type
It indicates whether the loan or application was for a one-to-four-family dwelling (other than manufactured housing), manufactured housing, or multifamily dwelling; available values are:
1 - One to four-family (other than manufactured housing)
2 - Manufactured housing
3 - Multifamily
NO PLAGIARISM POLICY - ORDER NEW DATA ANALYST CAPSTONE PROJECT ASSIGNMENT & GET WELL WRITTEN SOLUTIONS DOCUMENTS WITH FREE TURNTIN REPORT!
3. loan_purpose
Which Indicates whether the purpose of the loan or application was for home purchase, home improvement, or refinancing; available values are:
1 -- Home purchase
2 -- Home improvement
3 - Refinancing
4. occupancy
Indicates whether the property to which the loan application relates will be the owner's principal dwelling; available values are:
-- Owner-occupied as a principal dwelling
-- Not owner-occupied
-- Not applicable
5. loan_amount
The Size of the requested loan in thousands of dollars.
6. preapproval
Indicate whether the application or loan involved a request for a pre-approval of a home purchase loan; available values are:
1 -- Owner-occupied as a principal dwelling
2 -- Not owner-occupied
-- Not applicable
7. msa_md
A categorical with no ordering indicating Metropolitan Statistical Area/Metropolitan Division where a value of -1 indicates a missing value
8. state_code
A categorical with no ordering indicating the U.S. state where a value of -1 indicates a missing value
9. county_code
A categorical with no ordering indicating the county where a value of -1 indicates a missing value.
ENDLESS SUPPORT IN DATA ANALYST CAPSTONE PROJECT ASSIGNMENTS WRITING SERVICES - YOU GET REVISED OR MODIFIED WORK TILL YOU ARE SATISFIED WITH OUR DATA ANALYST CAPSTONE PROJECT ASSIGNMENT HELP SERVICES!
10. applicant_ethnicity (categorical)
Ethnicity of the applicant; available values are:
1 -- Hispanic or Latino
2 -- Not Hispanic or Latino
3 -- Information not provided by applicant in mail, Internet, or telephone pp lication
4 -- Not applicable
5 -- No co-applicant
11. applicant_race
Race of the applicant; available values are:
1 -- American Indian or Alaska Native
2 - Asian
3 -- Black or African American
4 -- Native Hawaiian or Other Pacific Islander
5 -- White
6 -- Information not provided by applicant in mail, Internet, or telephone ap plication
7-- Not applicable
8 -- No co-applicant
12. applicant_sex
Sex of the applicant; available values are:
1 -- Male
2 -- Female
3 -- Information not provided by applicant in mail, Internet, or telephone application
or 5 -- Not applicable
13. applicant_income
In thousands of dollars
HELPING STUDENTS TO WRITE QUALITY DATA ANALYST CAPSTONE PROJECT ASSIGNMENT AT LOW COST!
14. population
Total population in tract
15. minority_population_pct
Percentage of minority population to total population for tract
16. ffiecmedian_family_income
FFIEC Median family income in dollars for the MSA/MD in which the tract is located (adjusted annually by FFIEC)
17. tract_to_msa_md_income_pct
% of tract median family income compared to MSA/MD median family income
18. number_of_owner-occupied_units
Number of dwellings, including individual condominiums, that are lived in by the owner
19. number_of_1_to_4_family_units
Dwellings that are built to house fewer than 5 families.
20. lender
A categorical with no ordering indicating which of the lenders was the authority in approving or denying this loan
21. co_applicant (bool)
Indicates whether there is a co-applicant (often a spouse) or not
Key findings
1. Based on the neighbourhoods, The various effects on approval rates and loan pricing is getting by mortgage broker concentration.
2. This platform gives the number of features offered by mortgage market, then how the customers selecting the mortgage data.
3. It is identified that lock in consumer mortgages and the loan offers are searched by over all forty thousand users in each month.
4. The offered mortgage rate is identified by the values of rate spread which is vary based on the feature values and parameters.
5. The obtained Accuracy level of classified rate spread is efficient based on the design of our model.
GET READYMADE DATA ANALYST CAPSTONE PROJECT ASSIGNMENT SOLUTIONS - 100% PLAGIARISM FREE WORK DOCUMENT AT NOMINAL CHARGES!
Data Exploration
Data exploration lists the given numerical data and categorical data separately.
Numerical features:
Loan type
Property type
Loan purpose
Occupancy
Loan amount
Preapproval
Msa md
State code
County code
Applicant ethnicity
Applicant race
Applicant sex
Applicant income
population
minority population_pct
ffiecmedian family income
tract to_msa_md_income_pct
number_of_owner-occupied_units
number_of_1_to_4_family_units
lender
Categorical features:
Co applicant
MOST RELIABLE AND TRUSTWORTHY DATA ANALYST CAPSTONE PROJECT ASSIGNMENT HELP & HOMEWORK WRITING SERVICES AT YOUR DOORSTEPS!
METHODOLOGY
Machine learning model for prediction of Mortgage Rates From Government Data
This model uses naïve bayes classification algorithm to predict the mortgage rates.The working principle of naïve bayes algorithm is working under on the bayes theorem. The formula of bayes theorem is given below.
P(A|B) = (P(B¦A)P(A))/P(B) (1)
This equation can be rewritten as
P(y1|X) = (P(X¦y1)P(y1))/P(X) (2)
In equation (2), y1 represents the class of rate spread. X represents the values given in the dataset or feature vectors.
X can be expand as
X = (x1,x2,x3........xn)
In our dataset X consists of 21 features.
Therefore X will be
X = (x1,x2,......x21) (3)
Substitute (3) in (2), we get
P(y1|X=(x1,x2,......x21)) = (P(X¦y1)P(y1))/P(X)
That is
P(y1|x1,x2,......x21) = (P(x1¦y1)P(y1)P(x2¦y1)P(y1).........P(x21¦y1)P(y1))/(P(x1)P(x2).......P(x21)) (4)
Now substitute the data's into this equation to obtain the results. The value of denominator will not get affect or will not change for each entry given in the data. it act as a static value or constant. so that equation (4) can be expressed as
P(y1|x1,x2,......x21) ∝ argmax P(y1)∏(i=1)21P(xi|y1) (5)
y1 = argmaxP(y1)∏(i=1)21P(xi|y1) (6)
Equation (6) gives the final predicted results. The class of y1 should be more than or equal to 2.if the class variable more than two means it's a multivariate classification.
SAVE DISTINCTION MARKS IN EACH DATA ANALYST CAPSTONE PROJECT ASSIGNMENT WHICH IS WRITTEN BY OUR PROFESSIONAL WRITER!
Working Process
Step 1
Obtain the input data and read the data. This data can be consists both strings and numbers in the combined format.
Step 2
Reading the corresponding target values of given data. The length of target values should be same as the length of input data.
Step 3
Train the training data values using naive bayes model. For training the data both target and input data is needed.
Step 4
After the completion of training process, prediction will be done which is the main part of this process. For prediction we have to give the data alone into the model. Finally it will gives the predicted labels of the given input. Then the predicted labels are compared with the original labels, then the performance is calculated. Here we made prediction for both training and testing features.
Descriptive Statistics and Visualizations for Numeric Features
The given government data contains 200000 records. We have displayed the mean, standard deviation, minimum and maximum value of each numeric data.
|
Loan type
|
Property type
|
Loan purpose
|
Occupancy
|
Loan amount
|
Preapproval
|
Msa md
|
State code
|
County code
|
Applicant ethnicity
|
Applicant race
|
Applicant sex
|
Applicant income
|
population
|
minority population_pct
|
ffiecmedian family income
|
tract to_msa_md_income_pct
|
number_of_owner-occupied_units
|
number_of_1_to_4_family_units
|
lender
|
|
count
|
200000
|
200000
|
200000
|
200000
|
200000
|
200000
|
200000
|
2000000
|
200000
|
200000
|
200000
|
200000
|
200000
|
200000
|
200000
|
200000
|
200000
|
200000
|
200000
|
200000
|
|
mean
|
1.5709
|
1.1549
|
1.4826
|
1.0614
|
142.5749
|
2.7029
|
226.9750
|
28.2020
|
166.3352
|
1.9153
|
4.7627
|
1.4175
|
69.7299
|
5337.3
|
33.9071
|
63954
|
88.3900
|
1388.8
|
1907.9
|
2001.3
|
|
std
|
0.5594
|
0.3651
|
0.8222
|
0.2460
|
142.5595
|
0.5457
|
106.6553
|
15.5934
|
92.8525
|
0.5133
|
0.8873
|
0.5771
|
104.1197
|
2709.2
|
27.9868
|
14188
|
17.3932
|
717.0946
|
902.8414
|
1271.1
|
|
min
|
1
|
1
|
1
|
1
|
1
|
1
|
0
|
-1
|
0
|
1
|
1
|
1
|
1
|
7
|
0.3260
|
1
|
6.1930
|
1
|
1
|
0
|
|
max
|
4
|
3
|
3
|
3
|
11104
|
3
|
408
|
52
|
316
|
4
|
7
|
4
|
10042
|
34126
|
100
|
125095
|
100
|
8747
|
13615
|
4283
|
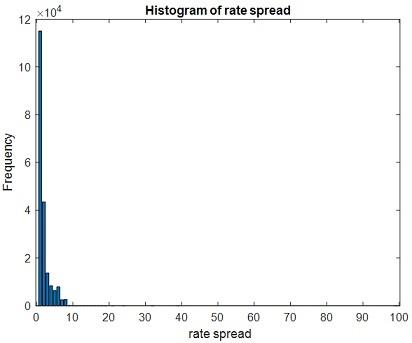
From the above figure we can observe that large number of datas coming under type 1. Total number of classes in rate spread is 24.
HIRE PROFESSIONAL WRITER FROM EXPERTSMINDS.COM AND GET BEST QUALITY DATA ANALYST CAPSTONE PROJECT ASSIGNMENT HELP AND HOMEWORK WRITING SERVICES!
Coding used
clc;
clear all;
close all;
warning off;
%% reading d
d=readtable('train_values.csv');
%% reading labels
labels=readtable('train_labels_abiUmgM.csv');
%%
lcol=[d.co_applicant];
lcol=char(lcol);
lcol=double(lcol);
alld=[d.loan_type d.property_type d.loan_purpose d.occupancy d.loan_amount d.preapproval d.msa_md d.state_code d.county_code d.applicant_ethnicity d.applicant_race d.applicant_sex];
alld1=[d.applicant_income d.population d.minority_population_pct d.ffiecmedian_family_income d.tract_to_msa_md_income_pct d.number_of_owner_occupied_units d.number_of_1_to_4_family_units d.lender];
alldata=[alld alld1 lcol];
alldata(isnan(alldata))=0;
traindata=alldata;
%% target data
tar=labels.rate_spread;
tar=num2str(tar);
%% data training
group = tar;
NBModel=fitcensemble(alldata,group,'Method','Bag','ScoreTransform' ,'logit','Prior' ,'uniform');
%% prediction for training data
x=predict(NBModel,alldata); % naive bayes output labels
group=str2num(group);
x=str2num(x);
cp=classperf(group,x);
accuracy=cp.CorrectRate;
Sensitivity=cp.Sensitivity;
Specificity=cp.Specificity;
disp('************************************************ Validation parameters for NB classifier using Training data ************************************************');
fprintf('\nAccuracy %d',accuracy*100);
fprintf('\nSensitivity %d\n',Sensitivity*100);
fprintf('\nSpecificity %d\n',Specificity*100);
out=table(d.row_id ,x,'VariableNames',{'row_id','rate_spread'});
% writetable(out,'Trainout.csv')
%% prediction for testing data
d=readtable('test_values.csv');
lcol=[d.co_applicant];
lcol=char(lcol);
lcol=double(lcol);
alld=[d.loan_type d.property_type d.loan_purpose d.occupancy d.loan_amount d.preapproval d.msa_md d.state_code d.county_code d.applicant_ethnicity d.applicant_race d.applicant_sex];
alld1=[d.applicant_income d.population d.minority_population_pct d.ffiecmedian_family_income d.tract_to_msa_md_income_pct d.number_of_owner_occupied_units d.number_of_1_to_4_family_units d.lender];
alldata=[alld alld1 lcol];
alldata(isnan(alldata))=0;
testdata=alldata;
x=predict(NBModel,testdata); % naive bayes output labels
x=str2num(x);
out=table(d.row_id ,x,'VariableNames',{'row_id','rate_spread'});
% writetable(out,'Testnewout.csv')
WE HELP STUDENTS TO IMPROVE THEIR GRADES! AVAIL TOP QUALITY DATA ANALYST CAPSTONE PROJECT ASSIGNMENT HELP AND HOMEWORK WRITING SERVICES AT CHEAPER RATE!
Analysis
For the given government data the methodology has been implemented and its tested. The training dataset is loaded in the tool using 'train_values.csv' file. The target values loaded in the tool using 'train_labels_abiUmgM.csv' file. After training processs, it is tested against the testing dataset by loading the 'test_values.csv'.initially the training data and its corresponding target data is trained with naïve bayes classifier. Then the prediction is done for the same training data. After that the performance metrices which are accuracy, sensitivity and specificity is calculated for the given training data. The predicted label is cross validated to the actual label in order to find out the quality metrics of the classifier. The predicted label of training data is converted into the csv format which is called 'Trainout.csv'. The predicted label of testing data is also saved converted into the csv format which is called 'Testout.csv'. The testing process of this methodology was processed on a personal computer which has a hardware specification of Intel core i5 processor with 3.40 GHz clock speed and 8 GB RAM (Random access memory) memory .The terms like True positive, True negative, False positive and False negative are got from the confusion matrix which is obtained based on the expected outcome and original label result for find out the calculation of accuracy, sensitivity, and specificity which is given below.
The obtained accuracy of given dataset is 83.8 which means 84 percentage of the predicted correctly and the remaining 16 percentage of the data is classified wrongly. Accuracy is calculated using the formula given below.
Accuracy = (TN+TP)/(TN+TP+FN+FP)
Where number of true positives is abbreviated into TP, which is used to calculate the total number of negative cases classified in a correct manner, then number of true negatives is called TN, which is used to calculate the total number of the positive class classified correctly. The number of false positive is denoted as FP, and it is used to calculate the total number of wrongly detected or classified negative cases. FN is nothing but the number of false negatives, when they are actually positive cases and, it is used to calculate the incorrectly classified labels or detected positive class. when they are actually in the case of negative , all of these predicted labels and its parameters are calculated using the total number of datas examined for the prediction of mortgage rates. The quality rate is determined by the accuracy which is the proportion of total number of class classified correctly that are negatively classified as negative and positively classified as positive from the whole number of class in the data examined .The formulas used to calculate sensitivity, and specificity is given below.
Sensitivity = TP/(TP+FN)
The obtained sensitivity of given dataset is 80.18.
Specificity = TN/(TN+FP)
The obtained specificity of given dataset is 92.05.
NEVER MISS YOUR CHANCE TO EXCEL IN DATA ANALYST CAPSTONE PROJECT ASSIGNMENT! AVAIL AFFORDABLE AND RELIABLE DATA ANALYST CAPSTONE PROJECT ASSIGNMENTS HELP SERVICES OF EXPERTSMINDS.COM!
|
Metrics
|
Values
|
|
Accuracy
|
83.79
|
|
sensitivity
|
80.18
|
|
specificity
|
92.05
|
This table shows the performance metrics of given data by using our model. The confusion matrix is given below which denotes the multiclass regression of given model.
|
92178
|
14578
|
5963
|
1729
|
283
|
285
|
19
|
50
|
3
|
2
|
0
|
0
|
0
|
0
|
0
|
0
|
0
|
0
|
0
|
0
|
0
|
0
|
1
|
0
|
|
6719
|
34015
|
1356
|
513
|
125
|
682
|
13
|
37
|
1
|
1
|
0
|
2
|
0
|
0
|
0
|
0
|
0
|
0
|
0
|
0
|
0
|
0
|
0
|
0
|
|
0
|
5
|
13562
|
26
|
21
|
41
|
1
|
6
|
0
|
0
|
0
|
1
|
0
|
0
|
0
|
0
|
0
|
0
|
0
|
0
|
0
|
0
|
0
|
0
|
|
0
|
0
|
1
|
8266
|
7
|
0
|
10
|
8
|
0
|
0
|
0
|
0
|
0
|
0
|
0
|
0
|
0
|
0
|
0
|
0
|
0
|
0
|
0
|
0
|
|
0
|
0
|
0
|
3
|
6333
|
0
|
7
|
10
|
0
|
0
|
0
|
0
|
0
|
0
|
0
|
0
|
0
|
0
|
0
|
0
|
0
|
0
|
0
|
0
|
|
0
|
0
|
1
|
7
|
10
|
7828
|
3
|
4
|
0
|
0
|
1
|
0
|
0
|
0
|
0
|
0
|
0
|
0
|
0
|
0
|
0
|
0
|
0
|
0
|
|
0
|
0
|
0
|
0
|
0
|
0
|
2454
|
1
|
0
|
0
|
0
|
0
|
0
|
0
|
0
|
0
|
0
|
0
|
0
|
0
|
0
|
0
|
0
|
0
|
|
0
|
0
|
0
|
0
|
0
|
0
|
1
|
2610
|
0
|
0
|
0
|
0
|
0
|
0
|
0
|
0
|
0
|
0
|
0
|
0
|
0
|
0
|
0
|
0
|
|
0
|
0
|
0
|
0
|
0
|
0
|
0
|
0
|
77
|
0
|
0
|
0
|
0
|
0
|
0
|
0
|
0
|
0
|
0
|
0
|
0
|
0
|
0
|
0
|
|
0
|
0
|
0
|
0
|
0
|
0
|
0
|
0
|
0
|
41
|
0
|
0
|
0
|
0
|
0
|
0
|
0
|
0
|
0
|
0
|
0
|
0
|
0
|
0
|
|
0
|
0
|
0
|
0
|
0
|
0
|
0
|
0
|
0
|
0
|
41
|
0
|
0
|
0
|
0
|
0
|
0
|
0
|
0
|
0
|
0
|
0
|
0
|
0
|
|
0
|
0
|
0
|
0
|
0
|
0
|
0
|
0
|
0
|
0
|
0
|
16
|
0
|
0
|
0
|
0
|
0
|
0
|
0
|
0
|
0
|
0
|
0
|
0
|
|
0
|
0
|
0
|
0
|
0
|
0
|
0
|
0
|
0
|
0
|
0
|
0
|
6
|
0
|
0
|
0
|
0
|
0
|
0
|
0
|
0
|
0
|
0
|
0
|
|
0
|
0
|
0
|
0
|
0
|
0
|
0
|
0
|
0
|
0
|
0
|
0
|
0
|
20
|
0
|
0
|
0
|
0
|
0
|
0
|
0
|
0
|
0
|
0
|
|
0
|
0
|
0
|
0
|
0
|
0
|
0
|
0
|
0
|
0
|
0
|
0
|
0
|
0
|
2
|
0
|
0
|
0
|
0
|
0
|
0
|
0
|
0
|
0
|
|
0
|
0
|
0
|
0
|
0
|
0
|
0
|
0
|
0
|
0
|
0
|
0
|
0
|
0
|
0
|
2
|
0
|
0
|
0
|
0
|
0
|
0
|
0
|
0
|
|
0
|
0
|
0
|
0
|
0
|
0
|
0
|
0
|
0
|
0
|
0
|
0
|
0
|
0
|
0
|
0
|
1
|
0
|
0
|
0
|
0
|
0
|
0
|
0
|
|
0
|
0
|
0
|
0
|
0
|
0
|
0
|
0
|
0
|
0
|
0
|
0
|
0
|
0
|
0
|
0
|
0
|
1
|
0
|
0
|
0
|
0
|
0
|
0
|
|
0
|
0
|
0
|
0
|
0
|
0
|
0
|
0
|
0
|
0
|
0
|
0
|
0
|
0
|
0
|
0
|
0
|
0
|
2
|
0
|
0
|
0
|
0
|
0
|
|
0
|
0
|
0
|
0
|
0
|
0
|
0
|
0
|
0
|
0
|
0
|
0
|
0
|
0
|
0
|
0
|
0
|
0
|
0
|
1
|
0
|
0
|
0
|
0
|
|
0
|
0
|
0
|
0
|
0
|
0
|
0
|
0
|
0
|
0
|
0
|
0
|
0
|
0
|
0
|
0
|
0
|
0
|
0
|
0
|
1
|
0
|
0
|
0
|
|
0
|
0
|
0
|
0
|
0
|
0
|
0
|
0
|
0
|
0
|
0
|
0
|
0
|
0
|
0
|
0
|
0
|
0
|
0
|
0
|
0
|
2
|
0
|
0
|
|
0
|
0
|
0
|
0
|
0
|
0
|
0
|
0
|
0
|
0
|
0
|
0
|
0
|
0
|
0
|
0
|
0
|
0
|
0
|
0
|
0
|
0
|
1
|
0
|
|
0
|
0
|
0
|
0
|
0
|
0
|
0
|
0
|
0
|
0
|
0
|
0
|
0
|
0
|
0
|
0
|
0
|
0
|
0
|
0
|
0
|
0
|
0
|
3
|
Conclusion
In this work, we are using government data to predict the mortgage rates. For the prediction of mortgage rates we are used machine learning model which is called naïve bayes classification. The results achieved by doing the experimentation which produces 83.8% accuracy. The results shows that the effectiveness of the machine learning model for predicting the mortgage rates. Based on the predicted outcome we conclude that the proposed model is suitable for the given government data. This work can be extended in the future to improve the accuracy of the classification , we are consider to use the effective techniques of the machine learning model by combining or optimization techniques with the classifier to increase the accuracy.
GET GUARANTEED SATISFACTION OR MONEY BACK UNDER DATA ANALYST CAPSTONE PROJECT ASSIGNMENT HELP SERVICES OF EXPERTSMINDS.COM - ORDER TODAY NEW COPY OF THIS ASSIGNMENT!