DO YOU WANT TO EXCEL IN CAPSIM MARKETING DEPARTMENT REPORT ASSIGNMENT? HIRE TRUSTED TUTORS FROM EXPERTSMINDS AND ACHIEVE SUCCESS!
Capsim Marketing Department Report Assignment
Question: Prepare a report on capsim simulation game.
Solution:
Introduction
Capsim marketing report is being prepared through different simulation games to fulfil its objectives based upon which the major decision making regarding business planning to strategize the marketing objectives as well as operational decision making can become much more smooth in terms of business performance. Different rounds of simulation are being conducted based upon which the decision making is been undertaken to reach a better strategic monitoring and decision making situation which can reveal the segments necessary for enhancing business performance (Henry, McCormack and Saeed, 2019). The report focuses upon incorporating major changes that occurred in each round of simulation to marketing of team Chester.
NEVER LOSE YOUR CHANCE TO EXCEL IN CAPSIM MARKETING DEPARTMENT REPORT ASSIGNMENT - HIRE BEST QUALITY TUTOR FOR ASSIGNMENT HELP!
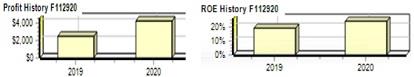
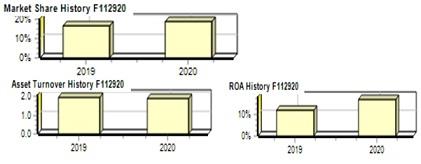
1st round decision
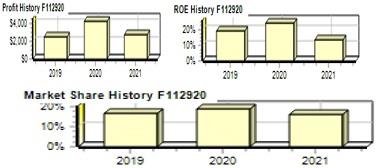
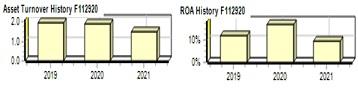
The first round of simulation provides a details regarding the profit history of 2019 and 2020 where it is been found the profit margins are at $2000 in 2019 and in 2020 it is at 4000 dollars. The ROE on the other hand is at 20% in 2019 in while in 2020 it is at 25%. The market share history in the financial year 2019 is at 15% while that of in the year 2020 is at 20%. The Asset turnover is at 2.0 by the year 2019 when it is decreased at 1.8 by the year 2020. The return on assets however is stuck at 10 % by 2019 while by 2020 it has increased to 20 %. The graphical representation can be incorporated as below:
The selected financial statistics can be represented as follows:
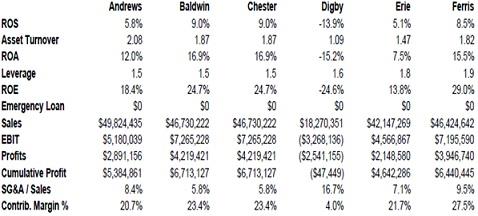
The Asset turnover of Chester is 1.8 which is similar to Baldwin and hence the return on assets is same in both the cases. In the first round of simulation there was no emergency loans for Chester and the sales is same for team Baldwin and team Chester. The cumulative profit gains as well as the EBIT and contribution margin are same for team Baldwin and team Chester.
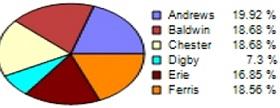
The market share reflects the fact that Andrews have the highest market share of 19.92 % while Baldwin and Chester both have the 2nd highest market capitalization of 18.68 % with Ferris at 18.56 % being the 3rd highest market share and Erie with the 4th highest market share followed by Digby with the 5th highest or the lowest market share of 7.3 %.
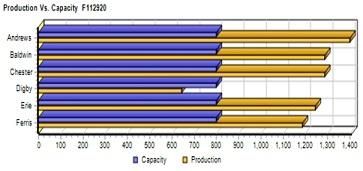
The production to that of capacity in case of Andrews is highest where it has production of 1400 units while that of the capacity it possesses is of 800 units. Baldwin and Chester is the production of 1270 units while they have the same capacity of 800 units. The production of Erie is of 1245 units while it has the capacity of 800 units. Ferris have the production of 1180 units and it possesses the same capacity level like all the others of 800 units. Digby has the capacity of 800 units while it is producing only 600 units.
EXPERTSMINDS.COM ACCEPTS INSTANT AND SHORT DEADLINES ORDER FOR CAPSIM MARKETING DEPARTMENT REPORT ASSIGNMENT - ORDER TODAY FOR EXCELLENCE!
2nd round decision
In the second round of simulation it is been found that in the year 2019 the profit was at $2000 and by 2020 it has been raised to 4000 dollars but by 2021 it have again decreased to $2,000. The ROE was at 20% by 2019 and at 25% by 2020 however it has decreased to 10% by the year 2021. The return on asset was at 10% by 2019 and has increased to 20% by 2020 while by 2021 it has decreased to 9%. The Asset turnover reviews the fact that by 2019 and 2020 it was at 2.0 while by the year 2021 it have decreased to 1.5. The market share conveys that by 2019 it was at 15% and by 2020 it have reached to 20% while by 2021 it have decreased to 13%. The graphical representations can be incorporated as follows:
The selected financial statistics can be represented as follows:
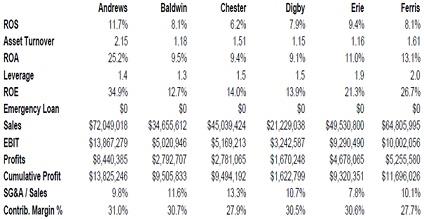
In the second round of simulation the ROS of Baldwin increased as compared to Chester which is 8.1 % and 6.2% respectively. However, it has a higher asset turnover of 1.5 as compared to Baldwin's 1.18. The return on assets is lower for Chester as the financial leverage is high to 1.5 compared to 1.3 of Baldwin. ROE of Chester is 14.0 % while sales and EBIT are 45039424 dollars and 5169213 dollars respectively. The profit margin of Chester is 2781065 dollars. It is been found that Chester have a higher SG&A to sales 13.3 while the contribution margin is 30.7 %.
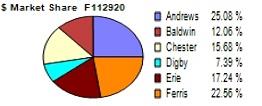
The market share reflects the fact that Andrews have the highest market share of 25.08 % which has increased from the 1st round of simulation while Baldwin has decreased more to 12.06 % being the 5th highest behind Chester which has also decreased compared to the 1st round of simulation to 4th highest at 15.68 % and that of Erie which has improved to 17.24 % being the 3rd highest. The 2nd highest is Ferris at 22.56 5 which has improved. The lowest is Digby with 7.39 % though it has improved as compared to the 1st round of simulation. Notably, Chester is able to maintain its market share at 15.68 % which is quite significant.
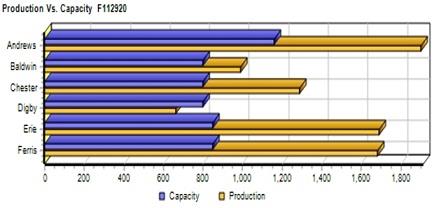
The production to that of capacity has improved in case of Andrews to that of 1880 while the capacity has also improved to 1080 units. In case of Erie and Ferris, the production have enhanced to 1640 units while the capacity remains at 840 units. In case of Chester the production is at 1230 units while the capacity of production is at 800 units. Digby remains the lowest with the capacity of 800 units while it has production of 610 units.
The net income of Chester has been found to decrease from 4219 dollars to that of 2781 dollars. The changes in the current asset and liabilities due to accounts payable entries in accounts receivable have decrease the net cash from operations for Chester from that of $ 6938 to $ 2270. Initially there were no plant improvements in the first of simulation in net terms however in the second round of simulation Chester has a plant improvement of 11770 dollars.
ORDER NEW CAPSIM MARKETING DEPARTMENT REPORT ASSIGNMENT & GET 100% ORIGINAL SOLUTION AND QUALITY WRITTEN CONTENTS IN WELL FORMATS AND PROPER REFERENCING.
3rd round decision
The third round of simulation reduce the fact the profit have increased to 4000 units by 2022 as it was found in 2020. The ROE has improved 18% by the year 2022 as compared to that of 2021 which was at 10% only. The market has also improved to 21% by 2022 however it was lower to 15% by 2021. The Asset turnover has also improved by 2022 to 1.7 as compared to that of 2021. The return on assets has increased to 12 % by 2022 which was lower in 2021.
The changes in the stock price of Chester are 0.39 dollars upon its share of 2000000. The price per earning ratio has been increased for Chester to 8.3 while the book value per share is 12.17 dollars. The bond market performance of Chester has a yield of 11.8 % in the year 2021. Compared to the previous year it is been found that the net income of Chester have increased to 4489 dollars which is quite significant. The net cash from operations have increased to $6339 which is due to account payable of 3509 dollars, depreciation of 2775 dollars as well as account receivable of 4476 dollars. From the investing activities the net improvement in plant cost $15,460. Retirement of long term debt is found to be $1000 why the retirement cash flows from the financial activities of current debt is 867 dollars. The total liabilities of the company have been 41845 dollars account payable of 6179 Dollars and contempt of 5984 dollars. It is been found that by the year 2020 the net profit was 2781 dollars while it has increased to 4489 dollars by the ending of 2021. The increasing profitability is majorly due to rise in sales from 45039 dollars in 2020 that of $77882 by 2021.
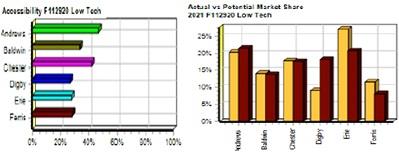
The actual versus potential market share in close of Chester is also found to be almost equal at 18 % by the 3rd round of simulation. The accessibility of Chester have increased to almost 4% and it have been able to maintain that at the appropriate in the consecutive years from 2019-20 and 2021. The valuation reflects significant performance of Chester City Cable to maintain its stability and balance in financial performance and its marketing initiatives.
4th round decision
The 4th round of simulation incorporates the fact that by 2023 profit margin has increased to $15,000 also enhancing the ROE 40%. The market share have also increased 222 percent by 2023 however the Asset turnover remains the same as 2022 to 2.0. The return on assets has increased at a very large amount to 30% by 2023 as compared to that of 12% in 2022.
5th round decision
The 5th round of simulation signifies that the result the profit have enhanced to 15500 dollars while the ROE has decreased to 30 % by 2024 as compared to that of 2023 and other years. The market share has however increased to 25% by the year 2023 while the Asset turnover has decreased to 1.6. The return on assets has also decreased to 22 % percent in the year 2024.
GET GUARANTEED SATISFACTION OR MONEY BACK UNDER CAPSIM MARKETING DEPARTMENT REPORT ASSIGNMENT HELP SERVICES OF EXPERTSMINDS.COM - ORDER TODAY NEW COPY OF THIS ASSIGNMENT!
6th round decision
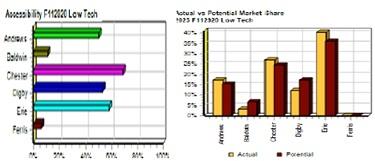
In front of simulation it is been found the Chester is able to increase its access ability to locate statistics which are increased to almost 65% as compared to other teams. The actual with respect to the potential market share is higher than expected in case of Chester because the actual market share was found to be 27% while the potential level is at 25%.
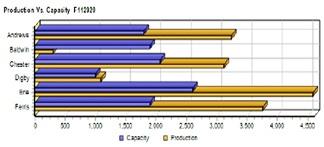
Figure 1: Production Analysis
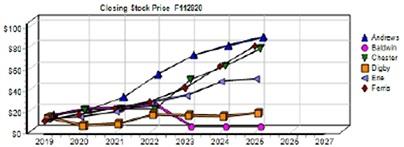
The production level of Chester is found to be 3000 units while it causes the capacity of 2000 units. From the cash flow statements it has been found that the net income of the company is 16040 dollars it is lower than Ferris which has a net income of $21407. However, Chester is able to maintain a monotonically increasing level of rise in its stock prices and shares from 2019 to 2025.
Chester has quite a significant rise in its potential level of cells which is found to be 112123 dollars which is a bit lower than Andrews and used and Ferris because of them has a sales level of $135019 and $154267 respectively. It has been found that despite of being in the range of highest sales even in the 6th round of simulation it is unable to increase its level of profit as expected which are basically due to its inability to reduce the variable cost in labour, materials and supply chain.
Recommendation and Conclusion
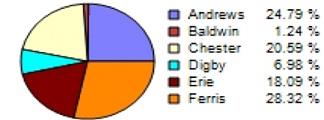
Conclusion can be drawn with the fact that from the financial forecasting that Chester is able to perform better depending upon its ability to enhance the promotional activities to different platforms through which they can reach their target consumer base which will consume their deployed production services. However, team tester has failed to maintain its profitability towards a significant level. The sales of Chester is quite good and it is found to be mechanical increasing what time duet lack in managing is variable cost and the factors that are related to it like labour, materials and carriage. It is been found that throughout the sixth simulations tester is able to increase its level of market share 20.59% which is quite good as compared to its parts out of simulation where it was 18.68%.Moreover, Ferris has it really improve its market share to become the most highest probability have performed greater than expectation as per the results of the 5th round of simulation letting Andrews to becomes the 3rd highest. Chester improved to become the second highest with 24.7 % market share. Digby has failed to improve its market capitalisation rather it has decreased in 2024 as compared to that of 2019. Baldwin is a disaster foreign investment as its market share has decreased to 0.75 % by 2024 though it looked to be the 2nd highest by 2019. From marketing perspective in order to ensure the future returns and marginal act is higher than the present Investments Chester should not only focus upon maximizing its sales and gain profitability but also its should understand the factors that are hindering its level of profitability. Expenses made upon promotional activities and marketing initiatives are quite at a justified level in case of Chester which helped the company to progress overtime however it is unable to reduce its expenses that are made in the form of variable cost which are labour, materials and carriage. It is recommended that the team of Chester focus upon its marketing initiatives by analysing appropriately is variable cost and enhancing the level of profitability by not only maximizing its sales but also by optimizing its expenses made upon factors related with its variable costs in order to boost its financial and marketing endeavours which will assist in further operational decision making.
DO WANT TO HIRE TUTOR FOR ORIGINAL CAPSIM MARKETING DEPARTMENT REPORT ASSIGNMENT SOLUTION? AVAIL QUALITY CAPSIM MARKETING DEPARTMENT REPORT ASSIGNMENT WRITING SERVICE AT BEST RATES!