DO YOU WANT TO EXCEL IN BUSINESS RESEARCH AND STATISTICAL ANALYSIS ASSIGNMENT? HIRE TRUSTED TUTORS FROM EXPERTSMINDS AND ACHIEVE SUCCESS!
HI6007 Statistics and Research Methods for Business Decision Making - Holmes Institute
Business Research and Statistical Analysis
1. Explain how statistical techniques can solve business problems
2. Identify and evaluate valid statistical techniques in a given scenario to solve business problems
3. Explain and justify the results of a statistical analysis in the context of critical reasoning for a business problem solving
4. Apply statistical knowledge to summarize data graphically and statistically, either manually or via a computer package
5. Justify and interpret statistical/analytical scenarios that best fits business solution
SAVE YOUR HIGHER GRADE WITH ACQUIRING BUSINESS RESEARCH AND STATISTICAL ANALYSIS ASSIGNMENT HELP & QUALITY HOMEWORK WRITING SERVICES OF EXPERTSMINDS.COM
Question 1
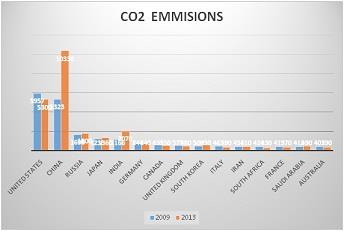
(a) Use an appropriate graphical technique to compare the amount of CO2 emissions (in millions of metric tonnes) in 2009 and 2013, broken down by the producer countries.
Solution:
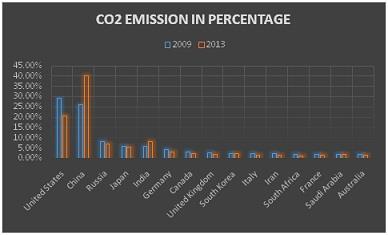
(b) Use an appropriate graphical technique to compare the percentage value of the amount of CO2 emissions (in %) in 2009 and 2013, broken down by the producer countries.
Solution:
b) CO2 EMISSIONS by percentage
(c) Comment your observations in parts (a) and (b).
Solution:
c) in part a) China had the highest amount of CO2 emission in the year 2013 compared to other countries. United States was the leading CO2 in the year 2009 compared to other countries.
In part b) china was the leading in percentage of CO2 gas emission in 2013 while United States was the leading in percentage of gas emission in the year 2009.
WORK TOGETHER WITH EXPERTSMIND'S TUTOR TO ACHIEVE SUCCESS IN BUSINESS RESEARCH AND STATISTICAL ANALYSIS ASSIGNMENT!
Question 2.
a. Construct a frequency distribution and a relative frequency distribution for the data.
b. Construct a cumulative frequency distribution and a cumulative relative frequency distribution for the data.
Solution: a & b
|
Classes
|
frequency
|
Relative frequency
|
CF
|
CRF
|
|
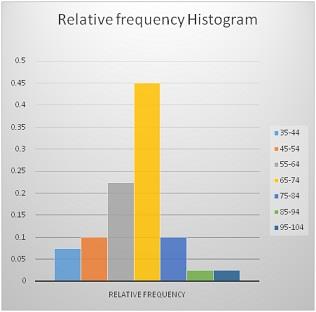
35-44
|
3
|
0.075
|
3
|
0.05
|
|
45-54
|
4
|
0.1
|
7
|
0.175
|
|
55-64
|
9
|
0.225
|
16
|
0.4
|
|
65-74
|
18
|
0.45
|
34
|
0.85
|
|
75-84
|
4
|
0.1
|
38
|
0.95
|
|
85-94
|
1
|
0.025
|
39
|
0.975
|
|
95-104
|
1
|
0.025
|
40
|
1
|
|
|
40
|
|
|
|
c. Plot a relative frequency histogram for the data.
Solution:
d. Construct an ogive for the data.
Solution:
d) Ogive graph
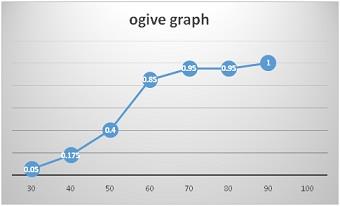
e. What proportion of the data is less than 65?
Solution: Proportion of data less than 65 is 16/40 which is 0.4
f. What proportion of the data is more than 75? Use following class intervals to answer the above questions
Solution: Proportion of data more than 75 is 6/40 which is 0.15
ARE YOU LOOKING FOR RELIABLE BUSINESS RESEARCH AND STATISTICAL ANALYSIS ASSIGNMENT HELP SERVICES? EXPERTSMINDS.COM IS RIGHT CHOICE AS YOUR STUDY PARTNER!
Question 3.
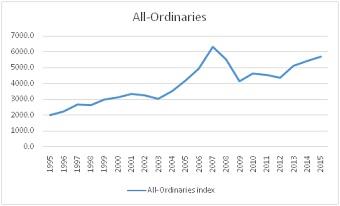
a. Using an appropriate graphical descriptive measure (relevant for time series data) describe the two variables.
Solution:
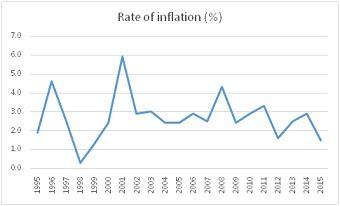
The time series data for the rate of inflation has benn rising and falling from the year 1995 to 2015.
Time series data for the rate of inflation seems to be in an uptrend since 1995. There was a decline in 2007 but it rose again until 2015
The two variables have different values for data. The rate of inflation has minimum values while All-ordinaries have high values in the data.
SAVE TOP GRADE USING BUSINESS RESEARCH AND STATISTICAL ANALYSIS ASSIGNMENT HELP SERVICE OF EXPERTSMINDS.COM
b. Use an appropriate plot to investigate the relationship between RATE OF INFLATION and ALL- ORDINARIES INDEX. Briefly explain the selection of each variable on the X and Y axes and why?
Solution:
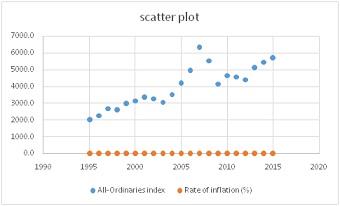
x- axis is All ordinaries index and y-axis is the rate of inflation. The all ordinaries determine the rate of inflation because it is the independent variable and the dependent variable is the rate of inflation.
c. Prepare a numerical summary report about the data on the two variables by including the summary measures, mean, median, range, variance, standard deviation, and coefficient of variation, smallest and largest values, and the three quartiles, for each variable.
Solution:
Descriptive Statistics
All-ordinaries
Sample Size, n: 21
Mean: 3982.733
Median: 4127.6
Midrange: 4169.2
RMS: 4161.737
Variance, s^2: 1.530783e+6
St. Dev., s: 1237.248
Mean Abs Dev: 1058.984
Range: 4336.8
Coeff. Of Var. 31.07%
Minimum: 2000.8
1st Quartile: 3032
2nd Quartile: 4127.6
3rd Quartile: 4933.5
Maximum: 6337.6
Sum: 83637.4
Sum Sq: 3.637211e+8
Descriptive Statistics
Rate of Inflation
Sample Size, n: 21
Mean: 2.690476
Median: 2.5
Midrange: 3.1
RMS: 2.931682
Variance, s^2: 1.423905
St. Dev., s: 1.193275
Mean Abs Dev: 0.8081633
Range: 5.6
Coeff. Of Var. 44.35%
Minimum: 0.3
1st Quartile: 2.4
2nd Quartile: 2.5
3rd Quartile: 2.9
Maximum: 5.9
Sum: 56.5
Sum Sq: 180.49
d. Calculate the coefficient of correlation (r) between RATE OF INFLATION and ALL-ORDINARIES INDEX. Then, interpret it.
Solution: Co-efficient of correlation
|
|
all ordinaries
|
rate of inflation
|
|
all ordinaries
|
1
|
|
|
rate of inflation
|
0.038875116
|
1
|
The correlation co-efficient between the two variables is 0.038 which is positive. This shows that the relationship is weak since it is less than 0.5.
DO YOU WANT TO EXCEL IN BUSINESS RESEARCH AND STATISTICAL ANALYSIS ASSIGNMENT - ORDER AT EXPERTSMINDS!
e. Estimate a simple linear regression model and present the estimated linear equation. Then, interpret the coefficient estimates of the linear model.
Solution: Linear regression
Regression analysis show the relationship between variables (Patten & Newhart, 2017).
Sample size, n: 21
Degrees of freedom: 19
Correlation Results:
Correlation coeff, r: 0.0388751
Critical r: ±0.4328579
P-value (two-tailed): 0.86713
Regression Results:
Y= b0 + b1x:
Y Intercept, b0: 2.54115
Slope, b1: 0.0000375
Total Variation: 28.4781
Explained Variation: 0.0430382
Unexplained Variation: 28.43506
Standard Error: 1.223349
Coeff of Det, R^2: 0.0015113
Linear equation
The Linear equation is given byY= b0 + b1x:
Y Intercept, b0: 2.54115
Slope, b1: 0.0000375
The Linear equation is Y= 2.54+ 0.0000375x
f. Determine the coefficient of determination R2 and interpret it.
Solution: Co-efficient of determination
The co-efficient of determination is 0.0015 meaning that 0.15% of the variation in the rate of inflation can be explained by the independent variable All-ordinaries.
g. Test the significance of the relationship at the 5% significance level.
Solution: P-value 0.867 >0.05 means that the model is insignificant for predicting the relationship between the variables.
h. What is the value of the standard error of the estimate (se). Then, comment on the fitness of the linear regression model?
Solution: Standard error
Standard Error: 1.223349
The linear regression is a weak fit for the prediction.
DONT MISS YOUR CHANCE TO EXCEL IN BUSINESS RESEARCH AND STATISTICAL ANALYSIS ASSIGNMENT! HIRE TUTOR OF EXPERTSMINDS.COM FOR PERFECTLY WRITTEN BUSINESS RESEARCH AND STATISTICAL ANALYSIS ASSIGNMENT SOLUTIONS!
Below are the related courses in which ExpertsMinds precisely deal with:
- HI6006 Competitive Strategy Assignment Help
- HI5004 Marketing Management Assignment Help
- HI6005 Management and Organisations in a Global Environment Assignment Help
- HI5014 International Business Across Borders Assignment Help
- HI6011 Leveraging Information Technology for Business Advantage Assignment Help
- HI6008 Business Research Assignment Help
- HI5010 Innovation and Entrepreneurship Assignment Help
- HI6012 Managing Operations and Supply Chains Assignment Help
- HI5013 Managing Across Borders Assignment Help
- HI5009 Leading and Managing People and Relationships for Performance Assignment Help