Correlation analysis
Some important definitions of correlation are given below:
''correlation analysis deals with the association between two or more variables. If two or more quantities very in sympathy so that movements in one tend to be accompanied by corresponding movements in the other (so then they are said to be correlated. When the relationship is of a quantitative nature, the appropriate statistical tool for discovering and measuring the relationship and expressing it in brief formula is known as corrosion. Correlation analysis attempts to determine the degree of relationship' between variables. Correlation is an analysis of the co variation between two or more variables."
Thus correlation is a statistical device which helps us in analysing the co variation of two or more variables.
Correlation analysis contributes to the understanding of economic behavior, aids in locating the critically important variables on which others depend, may reveal to the economist the connection by which disturbances spread and suggest to him the paths through which stabilizing forces may become effective.
In business, correlation analysis enables the executive to estimate costs, sales prices and other variables on the basis of some other series with which these costs, sales or prices may be functionally related. Some of the guesswork can be removed from decisions when the relationship between a variable to be estimated and the one or more other variables on which it depends are close and reasonably invariant.
Some of its main topics are:
1. correlation and causation
2. Karl Pearson's coefficient of correlation
3. significance of the study of correlation
Correlation and causation
Correlation analysis helps us in determining the degree of relationship between two or more variables-it does not tell us anything about cause and effect relationship. Even a high degree of correlation does not necessarily mean that a relationship of cues and effect exists between the variables or, simple stated, correlation does not necessarily imply causation or functional relationship though the existence of causation always implies correlation. By itself it establishes only coronation. The always implies correlation. By itself it establishes only co variation. The explanation of a significant degree of correlation may be any one, or combination of the following reasons;
(i) The correlation may be due to pure chance, especially in a small sample. We may get a high degree of correlation between two variables in a sample but in the universe there may not be any relationship between the variables at all. This is especially so in case of small samples. Such a correlation may arise either because of pure random sampling variation or because of the bias of the investigator in selecting the sample. The following example shall illustrate the point:
|
Income ($)
|
9500
|
9600
|
9700
|
9800
|
9900
|
|
Weight (lbs.)
|
120
|
140
|
160
|
180
|
200
|
The above data show a perfect positive relationship between income and weight, i.e. as the income is increasing the weight is increasing and the rate of change between and the rate of change between two variables is the same.
(ii) Both the correlated variables may be influenced by one or more other variables. It is just possible that a high degree of correlation between the variables may be due to some causes affecting each with the same effect. For example, a high degree of correlation between the yield per acre of rice and tea may be due to the fact that both are related to the amount of rainfall. But none of the two variables is the cause of the other. To take another example: suppose the correlation of teacher's salaries and the consumption of liquor over a period of year comes out to be 0.9, this does not prove that teachers drink; nor does it prove that liquor sale increases teacher's salaries. Instead, both variables move together because both are influenced by a third variable- Long run growth in national income and population.
(iii) Both the variables may be mutually influencing each other so that neither can be designated as he cause and the other the effect. There be mutually influencing each other so that neither can be designated as the cause and the other the effect. There may be a high degree of correlation between the variables but it may be difficult to pinpoint as to which is the cause and which is the effect. This is especially likely to be so in the case of which is the case economic variables. For example, such variables as demand and supply, price and protection, etc. mutually interact. To take a specific case, it is a well known principle of economics that as the price of a commodity increases its demand goes down and so price is the cause and demand of a commodity due to growth of population or other reasons may exercise an upward pressure on price. Thus, at times it may become difficult to explain from the two correlated variables which is the cause and which is the effect because both may be resting on each other.
The above points clearly bring out the fact that a mathematical relationship implies nothing in itself about cause and effect. In general, if factors A and Bare correlated, it may be that
(1) a causes to be sure but it might also be that
(2) b causes a,
(3) a and b influence each other continuously or intermittently.
(4) A and B are both influenced by C or
(5) The correlation is due to chance.
In many instances extremely high degree of correlation between two variables may be obtained when no meaning can be attached to the answer. There is, for example extremely high correlation between some series representing the production of pigs and the production of pig iron, yet no one has ever believed that this correlation has any meaning or that it indicates the existence of a cause-effect relation. By itself, it establishes only co variation. Correlation observed between variables that cannot conceivably be casually related is called spurious of nonsense correlation more appropriately; we should remember that it is interpretation of the degree of correlation that is spurious, not the degree of correlation itself. The high degree of correlation indicates only the mathematical result. We should reach a conclusion based on logical reasoning and intelligent investigation of significantly related matters, it only reading causation into spurious correlation but also interpreting spuriously a perfectly valid relationship.
Karl Pearson's coefficient of correlation
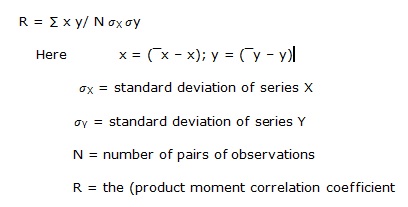
Of the several mathematical methods of measuring correlation the Karl person's method, popularly known as Pearson's coefficient of correlation, is most widely used in practice. The Pearson coefficient of correlation is dented by the symbol r. it is one of the very few symbols that are used universally for describing the degree of correlation between two series. The formula for computing Pearsonian r is:
This method is to be applied only where deviations of items are taken from actual mean and not from assumed mean.
The value of the coefficient of correlation as obtained by the above formula shall always lie between  1. When r = + 1, it means there is perfect positive correlation between the variables. When r = - 1, it means there is perfect negative correlation between the variables. However, in practice such values of r as + 1, - 1 and o are rare. We normally get values which lie between + 1 and - 1 such as + 0.8, - 0.26, etc the coefficient of correlation describes not only the magnitude o correlation but also its direction. Thus = 0.8 would mean that correlation is positive because the sigh of e is + and the magnitude of correlation is 0.8 similar - 0.26 means low degree of negative correlation.
The above formula for computing person's coefficient of correlation can be transformed to the following form which is easier to apply.
R* = ∑ x y/√∑x2 x ∑ y2
 Where, x = (x - x) and y = (y - y)
It is obvious that while applying this formula we have not to calculate separately the standard deviation of X and Y series as is required by formula
(I). this simplifies greatly the task of calculating correlation coefficient.
- Take the deviations of X series from the mean of X and denote these deviations by X.
- Square these deviations and obtain the total i.e. ∑ x2.
- Take the deviations of Y series from the mean of Y and denote these deviations by Y.
- Square these deviations and obtain the total i.e. ∑y2.
- Multiply the deviations of X and Y series and obtain the total i.e. ∑ x y.
- Substitute the values of ∑ x y, ∑ x2 and ∑ y2 in the above formula.
Illustration: calculate Karl Pearson's coefficient from the following data and interpret its value:
|
Roll no. of students
|
1
|
2
|
3
|
4
|
5
|
|
Marks in Accountancy
|
48
|
35
|
17
|
23
|
47
|
|
Marks in Statistics
|
45
|
20
|
40
|
25
|
45
|
Solution: let marks in Accountancy be denoted by X and marks in Statistics by Y.
|
Roll no.
|
X
|
(X - 34) x
|
X2
|
Y
|
(Y - 35) y
|
y2
|
xy
|
|
1
|
48
|
+14
|
196
|
45
|
+10
|
100
|
+140
|
|
2
|
35
|
+1
|
1
|
20
|
-15
|
225
|
-15
|
|
3
|
17
|
-17
|
289
|
40
|
+5
|
25
|
-85
|
|
4
|
23
|
-11
|
121
|
25
|
-10
|
100
|
+110
|
|
5
|
47
|
+13
|
169
|
45
|
+10
|
100
|
+130
|
|
|
ΣX = 170
|
Σx = 0
|
Σx2 = 776
|
ΣY = 0
|
Σy = 0
|
Σy2 = 550
|
Σxy = 280
|
r = Σxy/√Σ x2 × Σy2
x = (X - ‾X), y = (Y - ‾Y)
‾X = Σ X/N = 170/5 = 34; ‾Y = Σ‾Y/N = 175/5 = 35
Σxy = 280, Σx2 = 776, Σy2 = 550
r = 280/√776 ×550 = 280/653 - 299 = 0.429
Significance of the study of Correlation
The study of correlation is of immense use in practical life because of the following reasons:
1. Most of the variables show some kind of relationship. For example, there is relationship between price and supply, income and expenditure, etc. with the help of correlation analysis we can measure in one figure the degree of relationship existing between the variables.
2. Once we know that two variables are closely related, we can estimate the value of one variable given the value of another. This is known with the help of regression analysis.
So far we have studied problems relating to one variable only, in practice we come across a large number of problems involving the use of two or more than two variables. If two quantities vary in such a way that movements in one are accompanied by movements in the other, there quantities are correlated, for example, there exists some relationship between age of husband and age of wife. Price of commodity and amount demanded. Increase in rainfall up to a point and number of cinemagoers, etc. the degree of relationship between the variables under consideration is measured through the correlation analysis. The measure of correlation called the correlation coefficient or correlation index summarizes in one figure the direction and degree of correlation. The correlation analysis refers to the techniques used in measuring the closeness of the relationship between the variables.
The problem of analysing the relation between different series should be broken into three steps:
1. Determining whether a relation exists and, if it does measuring it.
2. Testing whether it is significant.
3. Establishing the cause and affect relation, if any.
Here only the first aspect will be discussed, for the second aspect a reference may be made on Tests of Significance. The third aspect in the analysis that of establishing the cause-effect relation, is difficult to be treated statistically. An extremely high and significant correlation between the increase in smoking and increase in lung cancer would not prove that smoking causes lung cancer. The proof of a cause and effect relation can be developed only by means of an exhaustive study of the operative elements themselves.
It should be noted that the detection and analysis of correlation (i.e. co variation) between two statistical variables requires relationship of some sort which associates the observation in pairs, one of each pair being a value of each of the two variables. In general, the pairing relationship may be of almost any nature, such as observations at the time or place or over a period of time or different places.
The computation concerning the degree of closeness is based on the regression equation. However it is possible to perform correlation analysis without actually having a regression equation.
In business, correlation analysis enables the executive to estimate costs, sales, prices and other variables on the basis of some other series with which these costs, sales or prices may be functionally related. Some of the guesswork can be removed from decisions when the relationship between a variable to be estimated and the one or more other variables on which it depends are close and reasonably invariant.
However, it should be noted that coefficient of correlation is one of the most widely used and also one of the most widely abused statistical measure. It is abused in the sense that one sometime overlooks the fact that correlation measures are nothing but the strength of linear relationship and that it does not necessarily imply a cause effect relationship.
Progressive development in the methods of science and philosophy has been characterized by increase in the knowledge of relationship or correlations. In nature also one finds multiplicity fo interrelated forces.
The effect of correlation is to reduce the range of uncertainty. The prediction based on correlation analysis to be more valuable and near to reality.
How we help you? - Correlation Analysis -Statistics Assignment Help 24x7
We offer Correlation Analysis assignment help, Correlation Analysis assignment writing help, assessments writing service, Correlation Analysis tutors support, step by step solutions to Correlation Analysis problems, Correlation Analysis answers, Statistics assignment experts help online. Our Statistics assignment help service is most popular and browsed all over the world for each grade level.
There are key services in Correlation Analysis Statistics which are listed below:-
- Correlation Analysis help
- Assignment Help
- Homework Help
- Correlation Analysis Assessments Writing Service
- Solutions to problems
- Statistics papers writing and editing
- Paper formatting and referencing
- Correlation Analysis research papers writing help
- Thesis and dissertation help
- Experts support 24x7
- Online tutoring
Why choose us - The first thing come in your mind that why choose us why not others what is special and different about us in comparison to other site. As we told you our team of expert, they are best in their field and we are always live to help you in your assignment which makes it special.
Key features of services are listed below:
- Confidentiality of student private information
- 100% unique and original solutions
- Step by step explanations of problems
- Minimum 4 minutes turnaround time - fast and reliable service
- Secure payment options
- On time delivery
- Unlimited clarification till you are done
- Guaranteed satisfaction
- Affordable price to cover maximum number of students in service
- Easy and powerful interface to track your order