MGMT 650 Statistics for Managerial Decision Making Assignment - University of Maryland Global Campus, USA
GET ASSURED A++ GRADE IN EACH MGMT 650 DESCRIPTIVE STATISTICS ASSIGNMENT ORDER - ORDER FOR ORIGINALLY WRITTEN SOLUTIONS!
Q1. Create a spreadsheet that automatically calculates your grade in this class as you enter the grades that you receive. It should include: 1) the weights of each graded assignment, 2) your grade in each assignment, and 3) your final grade. Be sure to label everything: such as the places where the information, is stored; the names of each assignment; and where to add the actual grades that you receive. Make this sheet user friendly; especially for users that see the sheet for the first time.
To use this for your benefit, you may want to design it so that it can be used to calculate your interim grade before you have all the grades. After this week, you will receive the solution from your professor and you will be able to use your solution or our solution for future classes.
|
Weights
|
0.075
|
0.05
|
0.05
|
0.05
|
0.1
|
0.05
|
0.05
|
0.1
|
0.05
|
0.075
|
0.2
|
0.15
|
|
|
|
Sl.No
|
Student iD
|
Homework
|
Quiz 3
|
Quiz 4
|
Quiz 5
|
Mid Term Exam
|
Quiz 7
|
Quiz 8
|
Critical Review
|
Quiz 10
|
Homework 11
|
Final Exam
|
Class Participation
|
Final Grade
|
Remarks
|
|
1
|
SID001
|
98
|
38
|
52
|
84
|
63
|
90
|
42
|
48
|
87
|
62
|
53
|
48
|
60.55
|
Grade C
|
|
2
|
SID002
|
80
|
44
|
92
|
79
|
55
|
48
|
73
|
45
|
36
|
52
|
77
|
89
|
67.25
|
Grade B
|
|
3
|
SID003
|
92
|
91
|
54
|
98
|
83
|
36
|
76
|
35
|
72
|
78
|
97
|
51
|
72.95
|
Grade B
|
|
4
|
SID004
|
71
|
91
|
41
|
93
|
62
|
40
|
59
|
55
|
35
|
32
|
98
|
52
|
64.775
|
Grade C
|
|
5
|
SID005
|
52
|
54
|
38
|
89
|
46
|
96
|
99
|
37
|
93
|
46
|
60
|
69
|
61.45
|
Grade C
|
|
6
|
SID006
|
49
|
61
|
66
|
34
|
62
|
78
|
35
|
81
|
70
|
40
|
83
|
56
|
63.175
|
Grade C
|
|
7
|
SID007
|
53
|
97
|
94
|
50
|
52
|
75
|
76
|
85
|
87
|
39
|
40
|
54
|
60.65
|
Grade C
|
|
8
|
SID008
|
82
|
68
|
91
|
35
|
66
|
76
|
96
|
97
|
35
|
40
|
31
|
62
|
61
|
Grade C
|
|
9
|
SID009
|
40
|
48
|
57
|
41
|
31
|
75
|
35
|
72
|
54
|
76
|
73
|
89
|
62.45
|
Grade C
|
|
10
|
SID010
|
40
|
54
|
60
|
71
|
71
|
96
|
33
|
83
|
48
|
39
|
84
|
31
|
60.875
|
Grade C
|
|
11
|
SID011
|
87
|
92
|
53
|
89
|
74
|
36
|
40
|
70
|
96
|
49
|
44
|
69
|
64.05
|
Grade C
|
|
12
|
SID012
|
57
|
59
|
60
|
70
|
82
|
44
|
95
|
34
|
77
|
87
|
64
|
32
|
60.25
|
Grade C
|
|
13
|
SID013
|
76
|
64
|
94
|
63
|
78
|
32
|
81
|
70
|
62
|
43
|
88
|
58
|
69.825
|
Grade B
|
|
14
|
SID014
|
92
|
32
|
87
|
66
|
74
|
33
|
61
|
45
|
51
|
53
|
47
|
68
|
58.875
|
Grade C
|
|
15
|
SID015
|
33
|
98
|
44
|
66
|
42
|
57
|
68
|
64
|
36
|
55
|
79
|
41
|
57.6
|
Grade C
|
|
Points
|
Weight Acheved
|
Grade
|
|
Homework
|
98
|
7.35
|
98%
|
|
Quiz 3
|
38
|
1.9
|
38%
|
|
Quiz 4
|
52
|
2.6
|
52%
|
|
Quiz 5
|
84
|
4.2
|
84%
|
|
Mid Term Exam
|
63
|
6.3
|
63%
|
|
Quiz 7
|
90
|
4.5
|
90%
|
|
Quiz 8
|
42
|
2.1
|
42%
|
|
Critical Review
|
48
|
4.8
|
48%
|
|
Quiz 10
|
87
|
4.35
|
87%
|
|
Homework 11
|
62
|
4.65
|
62%
|
|
Final Exam
|
53
|
10.6
|
53%
|
|
Class Participation
|
48
|
7.2
|
48%
|
NO PLAGIARISM POLICY - ORDER NEW MGMT 650 DESCRIPTIVE STATISTICS ASSIGNMENT & GET WELL WRITTEN SOLUTIONS DOCUMENTS WITH FREE TURNTIN REPORT!
Q2. Here is sample data showing the length of nails in boxes labled 1 1/4 inch. The data is in inches.
|
1.26
|
1.22
|
1.27
|
1.21
|
1.22
|
1.25
|
1.22
|
1.25
|
1.25
|
1.23
|
|
1.24
|
1.24
|
1.29
|
1.24
|
1.27
|
1.29
|
1.23
|
1.22
|
1.23
|
1.26
|
|
1.28
|
1.25
|
1.25
|
1.23
|
1.26
|
1.23
|
1.26
|
1.29
|
1.26
|
1.26
|
|
1.23
|
1.21
|
1.23
|
1.21
|
1.22
|
1.22
|
1.24
|
1.21
|
1.23
|
1.25
|
|
1.21
|
1.28
|
1.26
|
1.25
|
1.22
|
1.29
|
1.22
|
1.22
|
1.29
|
1.24
|
|
1.21
|
1.22
|
1.23
|
1.26
|
1.28
|
1.26
|
1.28
|
1.21
|
1.21
|
1.21
|
|
1.29
|
1.26
|
1.26
|
1.28
|
1.25
|
1.24
|
1.24
|
1.27
|
1.28
|
1.24
|
|
1.21
|
1.25
|
1.23
|
1.25
|
1.29
|
1.29
|
1.22
|
1.21
|
1.28
|
1.27
|
For the following questions, you must use Excel formulas in the cells so that Excel calculates the answers for you.
1) Compute the mean:
1.246
Compute the median
1.245
Find the mode
1.260
2) Compute the first quartile; use =QUARTILE.EXC()
1.220 First Quartile
Compute the third quartile; use =QUARTILE.EXC()
1.260 Third Quartile
3) Compute the interquartile range
0.040
4) Find the largest number
1.290
Find the smallest number
1.210
What is the range?
0.080
5) What is the Variance? Use =VAR.S()
0.001
What is the standard deviation? Use =STDEV.S()
0.026
6) What is the Coefficient of Variation, or the CV?
2.07%
7) When is the Coefficient of Variation especially useful?
The coefficient of variation is useful in finding the precision of the variable
Copy all of the data into a column, use Column M and go from cell M1:M80
ENDLESS SUPPORT IN MGMT 650 DESCRIPTIVE STATISTICS ASSIGNMENTS WRITING SERVICES - YOU GET REVISED OR MODIFIED WORK TILL YOU ARE SATISFIED WITH OUR MGMT 650 DESCRIPTIVE STATISTICS ASSIGNMENT HELP SERVICES!
8) Use the Data Analysis tool on the numbers just copied to find the Descriptive Statistics:
Click on Data Analysis and Choose Descriptive Statistics
Click on the Summary Statistics box.
Highlight the mean, median, mode, Standard deviation, Range, Minimum, and Maximum
Notice that the Data Analysis tool gives you all of the info needed for this problem except for the quartiles, variance, and CV
|
Column1
|
|
Mean
|
1.2459
|
|
Standard Error
|
0.0029
|
|
Median
|
1.245
|
|
Mode
|
1.26
|
|
Standard Deviation
|
0.0258
|
|
Sample Variance
|
0.0007
|
|
Kurtosis
|
-1.113
|
|
Skewness
|
0.2358
|
|
Range
|
0.08
|
|
Minimum
|
1.21
|
|
Maximum
|
1.29
|
|
Sum
|
99.67
|
|
Count
|
80
|
9) Interpret the measures of central tendency within the context of this problem. Should the company producing the nails be concerned about the central tendency?
The mean length of nails in the box is 1.246 inch with a standard deviation of 0.026 inches. The median length of nails in the box is 1.245 inches and the recorded minimum and maximum length of the nails in the box is 1.21 inches and 1.29 inches respectively.
10) Interpret the measures of variation within the context of this problem. Should the company producing the nails be concerned about variation?
The standard deviation is 0.026 inches and the coefficient of variation is 2.07%, indicating that the variation does not show any biggest concern and hence the management can proceed with the current produciton technique.
11) Using the data on the Pivot Table Data Sheet, create a Pivot table showing.
The Type of Movie and the Domestic Gross of each Type; columns D and I on the Pivot Table Data Sheet.
Have three columns: Type, Count of Type, and Sum of Total Domestic Gross.
Format the Domestic Gross Field using $.
|
Row Labels
|
Count
|
Sum
|
|
Action
|
19
|
$1,269,342,930.00
|
|
Cartoon
|
12
|
$1,634,739,914.00
|
|
Comedy
|
37
|
$1,148,151,141.00
|
|
Documentary
|
10
|
$106,445,628.00
|
|
Drama
|
55
|
$1,479,028,725.00
|
|
Family
|
4
|
$246,128,748.00
|
|
Fantasy
|
4
|
$427,793,715.00
|
|
Horror
|
14
|
$779,935,002.00
|
|
Musical
|
2
|
$291,335,107.00
|
|
Romance
|
2
|
$25,937,130.00
|
|
Sci-Fi
|
13
|
$868,541,436.00
|
|
SuperHero
|
6
|
$2,459,594,075.00
|
|
Thriller
|
20
|
$627,854,287.00
|
|
Unknown
|
1
|
$2,999,134.00
|
|
Western
|
1
|
$3,143,056.00
|
|
Grand Total
|
200
|
$11,370,970,028.00
|
HELPING STUDENTS TO WRITE QUALITY MGMT 650 DESCRIPTIVE STATISTICS ASSIGNMENT AT LOW COST!
12) Which type of movie had the highest Domestic Gross Total for 2018?
Super Hero
13) Which type of movie had the highest number of films made of that type in 2018?
Documentary
(You might try making more/different pivot tables to learn about the raw data. What do you want to know about Domestic Movies in 2018?)
Number of likes and dislikes for the movie.
Number of people who visited the theatre to watch the movie.
14) Use the Data in the Pivot Table Data Sheet to create a Frequency Chart:
What is the Total DomesticGross of the lowest movie sales? Hint - use either =MIN()or just choose the movie at the bottom of the list
$2,032,018
What is the Total DomesticGross of the highest movie sales? Hint - use either =MAX()or just choose the movie at the top of the list
$700,059,566
15) Subtract the lowest from the highest
The range of Total Domestic Gross for these movies is
$698,027,548
16) We will use 10 bins so divide the range by 10:
$69,802,754.80
Each bin will be: $69,802,755 wide.
Start with the minimum number: $69,802,754.80
Add the width of the bins $69,802,754.80
This number is the highest total for the first bin. Put this number is cell C21 for the first bin.
Now add the number that you just put into cell 21 to cell C27. Remember that C13 contains the width of each bin.
The next bin highest number starts with the first bin highest number and adds the size of the bins
Therefore, the second bin begins with $139,605,509.60 and adds the bin size $69,802,754.80 to get $209,408,264.40
Continue adding to get the Bins array for the =FREQUENCY() function.
The last bin number in cell C36 will equal the highest Domestic Gross movie total.
GET READYMADE MGMT 650 DESCRIPTIVE STATISTICS ASSIGNMENT SOLUTIONS - 100% PLAGIARISM FREE WORK DOCUMENT AT NOMINAL CHARGES!
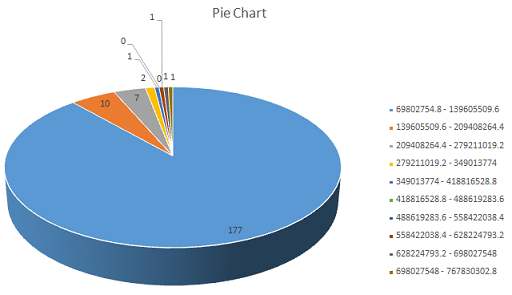
17) Here are the highest numbers for each bin:
|
Bins:
|
Frequency:
|
|
$69,802,755
|
$139,605,509.60
|
177
|
|
$139,605,509.60
|
$209,408,264.40
|
10
|
|
$209,408,264.40
|
$279,211,019.20
|
7
|
|
$279,211,019.20
|
$349,013,774.00
|
2
|
|
$349,013,774.00
|
$418,816,528.80
|
1
|
|
$418,816,528.80
|
$488,619,283.60
|
0
|
|
$488,619,283.60
|
$558,422,038.40
|
0
|
|
$558,422,038.40
|
$628,224,793.20
|
1
|
|
$628,224,793.20
|
$698,027,548.00
|
1
|
|
$698,027,548.00
|
$767,830,302.80
|
1
|
18) Follow the instructions in the youtube videos to use the =FREQUENCY() array function.
You know that you have correctly used the =FREQUENCY() function if Excel automatically puts {} around the function.
Don't forget to push Control-Shift-Enter at the same time to enter the =FREQUENCY function.
|
Bins:
|
Frequency:
|
|
$69,802,755
|
$139,605,509.60
|
177
|
|
$139,605,509.60
|
$209,408,264.40
|
10
|
|
$209,408,264.40
|
$279,211,019.20
|
7
|
|
$279,211,019.20
|
$349,013,774.00
|
2
|
|
$349,013,774.00
|
$418,816,528.80
|
1
|
|
$418,816,528.80
|
$488,619,283.60
|
0
|
|
$488,619,283.60
|
$558,422,038.40
|
0
|
|
$558,422,038.40
|
$628,224,793.20
|
1
|
|
$628,224,793.20
|
$698,027,548.00
|
1
|
|
$698,027,548.00
|
$767,830,302.80
|
1
|
Copy the Bins and Frequency Data from the Q4 - Frequency sheet
|
Frequency:
|
|
$177.00
|
|
$10.00
|
|
$7.00
|
|
$2.00
|
|
$1.00
|
|
$-
|
|
$-
|
|
$1.00
|
|
$1.00
|
|
$1.00
|
MOST RELIABLE AND TRUSTWORTHY MGMT 650 DESCRIPTIVE STATISTICS ASSIGNMENT HELP & HOMEWORK WRITING SERVICES AT YOUR DOORSTEPS!
19) Histogram - Create a Histogram of the Bins and Frequency data by first creating a column Chart.
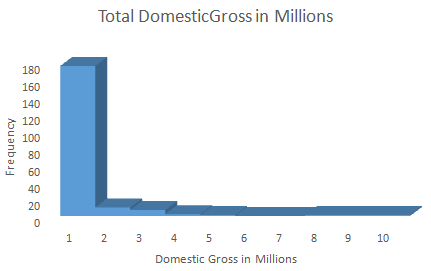
20) Format the historgram so there are no spaces between the bars. Histograms have not spaces and the graph does not become a Histogram until the spaces are removed.
Add a title to the Histogram
Add horizontal and Vertical Axes titles
21) Explain the difference between a histogram and a bar graph:
Histogram is used to continuous data and has no space in between the bars. On the other hand, bar chart is used for qualitative data which normally used to be separated with gaps between the bars
22) Make a pie chart of the frequency data with a title and Legend:
SAVE DISTINCTION MARKS IN EACH MGMT 650 DESCRIPTIVE STATISTICS ASSIGNMENT WHICH IS WRITTEN BY OUR PROFESSIONAL WRITER!
Access our Best University of Maryland Global Campus, USA Assignment Help Service for Various Courses and Units, Such As -
- MGMT 670 Strategic Management Capstone Assignment Help
- BMGT 110 Introduction to Business and Management Assignment Help
- BMGT 330 Entrepreneurship and New Venture Planning Assignment Help
- MGMT 640 Financial Decision Making for Managers Assignment Help
- BMGT 305 Knowledge Management Assignment Help
- BMGT 304 Managing E-Commerce in Organizations Assignment Help
- MGMT 630 Organizational Theory and Behavior Assignment Help
- BMGT 317 Decision Making Assignment Help
- BMGT 372 Supply Chain Management Assignment Help
- MGMT 615 Intercultural Communication and Leadership Assignment Help
- BMGT 335 Small Business Management Assignment Help
- BMGT 365 Organizational Leadership Assignment Help
- MGMT 610 Organizational Theory Assignment Help
- BMGT 456 Managing Across Cultures and Borders Assignment Help