ITECH1103 Big Data And Analytics, Federation University, Australia
ARE YOU LOOKING FOR RELIABLE ITECH1103 BIG DATA AND ANALYTICS ASSIGNMENT HELP SERVICES? EXPERTSMINDS.COM IS RIGHT CHOICE AS YOUR STUDY PARTNER!
Task 1: Background information - Write a description of the dataset and project, and its importance for the organization. Discuss the main benefits of using visual analytics to explore big data.
Answer: There are various data firms in the United States which have the large collection of data regarding the strike of the bird into the aircraft. But these data sets have very random data and to synthesize it to find out the relevant part is a challenging task. For the processing part we will use the big data analytic tool. Outcome we get from the big data analysis needs modification and organization, for that part we use the visual analytics. This visual analytic tool will help to the find the connections and relations between the data set. This whole process will help to the concerned organization to make effective decisions and the necessary corrective measures to boycott or avoid the accidents or bird strikes. This synthesized data will also help the organization for betterment of the business and to take the correct decision by the management authority.
Using these big data tool and the visualization technique will help the concerned company to reach its goal. To counter the problem company need the solution and solution will come following the trend or corrective path followed by other successful organization, to get this information we need to process out large sum of examples and data sets and this cannot be possible without the help of these processing and analyzing tool as no human being will be able to do this job by his own or by a group of people in the given frame of time. These analyses can take lot of time if performed manually and these analytical tools can give the result in a quick session.
The records of data given to us are:
Aircraft: Type
Airport: Name
Altitude bin
Aircraft: Make/Model
Wildlife: Number struck
Effect: Impact to flight
Effect: Other
Location: Nearby if en route
Aircraft: Flight Number
FlightDate
Record ID
Effect: Indicated Damage
Location: Freeform en route
Aircraft: Number of engines?
Aircraft: Airline/Operator
Origin State
When: Phase of flight
Conditions: Precipitation
Remains of wildlife collected?
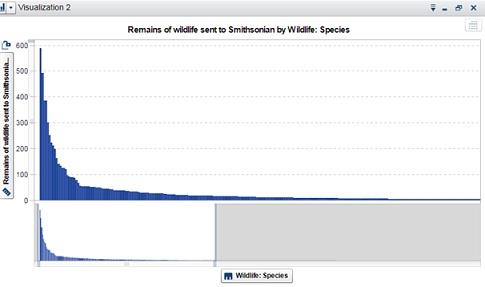
Remains of wildlife sent to Smithsonian
Remarks
Conditions: Sky
Cost: Aircraft time out of service (hours)
Cost: Other (inflation adj)
Cost: Repair (inflation adj)
Cost: Total $
Feet above ground
Miles from airport
Number of human fatalities
Number of people injured
Pilot warned of birds or wildlife?
Reported: Date
Speed (IAS) in knots
When: Time (HHMM)
When: Time of day
Wildlife: Size
Wildlife: Species
Task 2 - Reporting / Dashboards - For your project, perform the relevant data analysis tasks and identify the visualization you need to develop.
Answer: We have the big data of colliding the birds with the aircraft and this big data have all the necessary and relevant part that is needed by the organization. With the help of the visualization tool we will be able to see the result as per the need of the client. We have to be ready for any improvement or update from the client and to the outcome of the data, processed by the big data. In this big data all the species of birds presented in the world is given, which is not required. We are only concerned with the birds that are flying in the particular country, here it is United States. Following data base represents only those birds category which are hit by the aircraft while landing or take off. We have done the required formatting of the data of the bird strikes to the aircraft as per the system required indexing.
Question 1: Data Dictionary of the given data
Answer:
|
Name
|
Meaning
|
Data Type
|
Classification
|
|
Aircraft: Type
|
Type of Aircraft
|
character
|
category
|
|
Airport: Name
|
Name of Airport where plane took off
|
character
|
category
|
|
Altitude bin
|
Altitute level when birdstrike occurred
|
character
|
category
|
|
Aircraft: Make/Model
|
Make/Model of Aircraft that was hit
|
character
|
category
|
|
Wildlife: Number struck
|
Number of birdstrikes for this event
|
numeric
|
category
|
|
Effect: Impact to flight
|
Impact of the birdstrike on the flight
|
character
|
category
|
|
Effect: Other
|
Effect of birdstrike other that on the flight
|
character
|
category
|
|
Location: Nearby if en route
|
Nearby location when birdstrike occurred when close to airport
|
character
|
category
|
|
Aircraft: Flight Number
|
Flight number of flight that had a birdstrike
|
character
|
category
|
|
FlightDate
|
Date of the flight when the birdstrike occurred
|
date and time
|
category
|
|
Record ID
|
Record ID
|
numeric
|
measure
|
|
Effect: Indicated Damage
|
Damage caused by the birdstrike
|
character
|
category
|
|
Location: Freeform en route
|
When not close to take-off or landing airport
|
character
|
category
|
|
Aircraft: Number of engines?
|
Number of engines on plane that was struck
|
character
|
category
|
|
Aircraft: Airline/Operator
|
Airline operating the fight that was struck
|
character
|
category
|
|
Origin State
|
Origin state of the flight that was struck
|
character
|
category
|
|
When: Phase of flight
|
What phase of the flight when aircraft struck
|
character
|
category
|
|
Conditions: Precipitation
|
Weather condidtions when birdstrike occurred
|
character
|
category
|
|
Remains of wildlife collected?
|
Remains of the wildlife that struck the plane
|
numeric
|
measure
|
|
Remains of wildlife sent to Smithsonian
|
What remains if any were sent to the Smithsonian
|
numeric
|
measure
|
|
Remarks
|
Remarks to amplify the birdstrike event
|
character
|
category
|
|
Conditions: Sky
|
conditions of the sky when bird strike happened
|
character
|
category
|
|
Cost: Aircraft time out of service (hours)
|
distribution of cost when aircraft time out of service
|
numeric
|
measure
|
|
Cost: Other (inflation adj)
|
distribution of cost to other during birdstrike
|
numeric
|
measure
|
|
Cost: Repair (inflation adj)
|
distribution of cost to repair during birdstrike
|
numeric
|
measure
|
|
Cost: Total $
|
distribution of total cost during birdstrike
|
numeric
|
measure
|
|
Feet above ground
|
distribution of feet above ground during birdstrike
|
numeric
|
measure
|
|
Miles from airport
|
distribution of miles from airport when bird strike occurred
|
numeric
|
measure
|
|
Number of human fatalities
|
distribution of number of human fatalitieswhen bird strike occurred
|
numeric
|
measure
|
|
Number of people injured
|
distribution of number of people injured during birdstrike
|
numeric
|
measure
|
|
Pilot warned of birds or wildlife?
|
frequency of pilot warned of birds and wildlife during birdstrike
|
character
|
category
|
|
Reported: Date
|
frequency of reported date during birdstrike
|
date and time
|
category
|
|
Speed (IAS) in knots
|
distribute of speed in knots during birdstrike
|
numeric
|
measure
|
|
When: Time (HHMM)
|
distribution of time during birdstrike
|
numeric
|
measure
|
|
When: Time of day
|
frequency of time of day during birdstrike
|
character
|
category
|
|
Wildlife: Size
|
frequency of wildlife size during birdstrike
|
character
|
category
|
|
Wildlife: Species
|
frequency of wildlife species during birdstrike
|
character
|
category
|
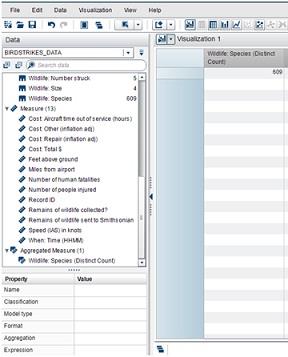
Question 2: How many different species (distinct) have been involved in bird strikes?
Answer:
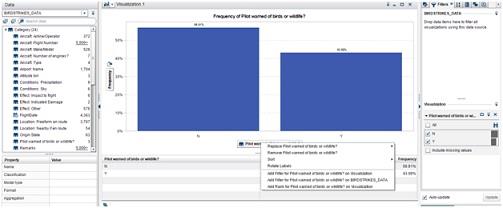
Question 3: Where the data has been recorded, what percentage of the time was the pilot warned of birds or wildlife?
Answer:
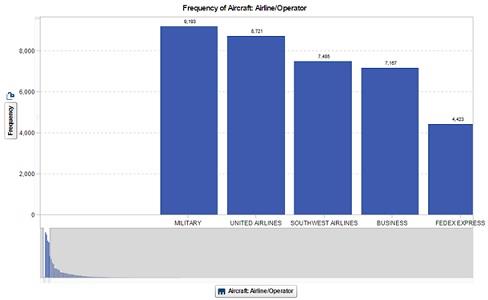
Question 4: What are the top five airline/operators involved in bird strikes?
Answer:
SAVE YOUR HIGHER GRADE WITH ACQUIRING ITECH1103 BIG DATA AND ANALYTICS ASSIGNMENT HELP AND QUALITY ASSESSMENT WRITING SERVICES OF EXPERTSMINDS.COM!
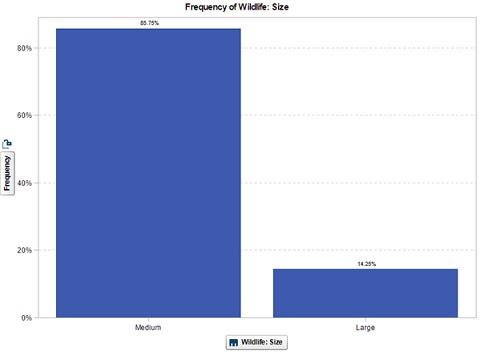
Question 5: What proportion (percentage) of bird strikes involved medium and large wildlife?
Answer:
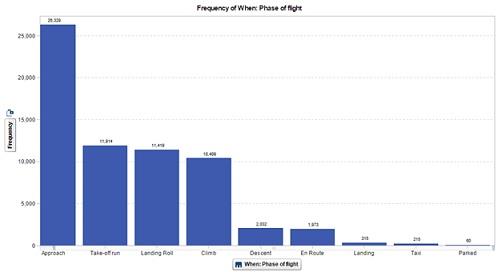
Question 6: In which phase of flight would the aircraft be most likely to experience a bird strike?
Answer:
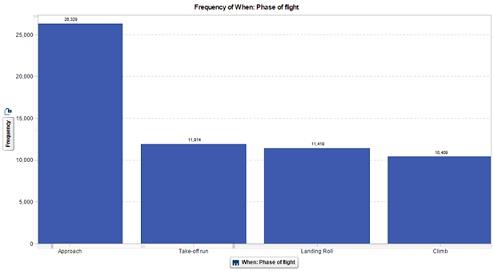
Question 7: Has a bird strike ever occurred whilst the aircraft was parked? If so, in how many instances?
Answer:
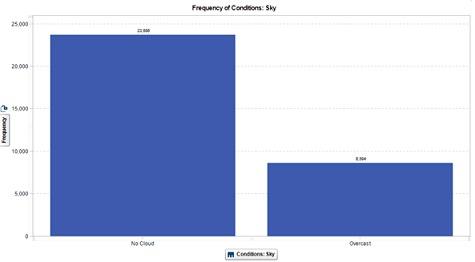
Question 8: Is a bird strike more likely to happen when there is no cloud as compared with overcast conditions?
Answer:
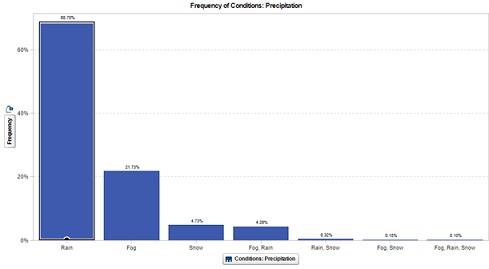
Question 9: In what precipitation conditions is a bird strike most likely to happen?
Answer:
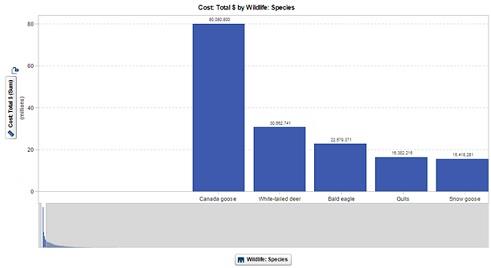
Question 10: Which species of wildlife had the largest total cost? How much was this?
Answer:
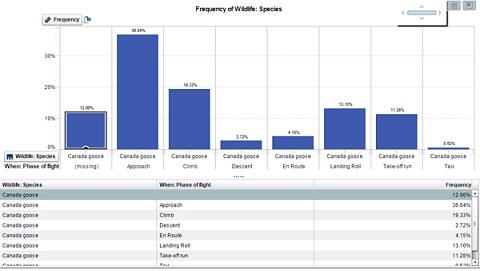
Question 11: For the most costly species of wildlife, which phase of flight was the most common for a bird strike?
Answer:
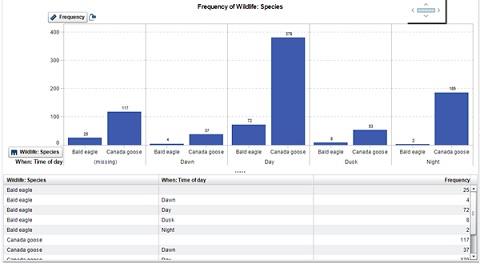
Question 12: For the species Bald Eagle and Canadian Goose, examine the time of day that bird strikes occur to see if there are any differences between the two species.
Answer:
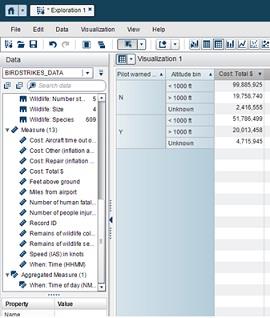
Question 13: Investigate using a crosstab for the data values Pilot warned of bird strike, Altitude bin, and the total cost.
Answer:
ORDER NEW ITECH1103 BIG DATA AND ANALYTICS ASSIGNMENT AND GET 100% ORIGINAL SOLUTION AND QUALITY WRITTEN CONTENTS IN WELL FORMATS AND PROPER REFERENCING!
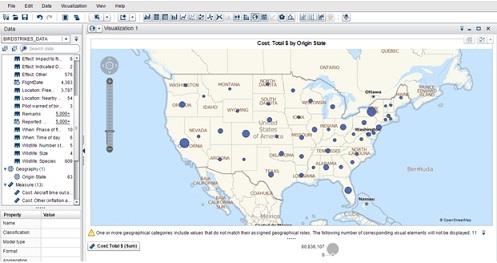
Question 14: Create a geomap of the bird strike data.
Answer:
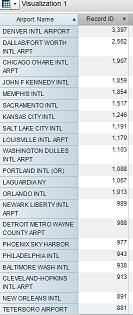
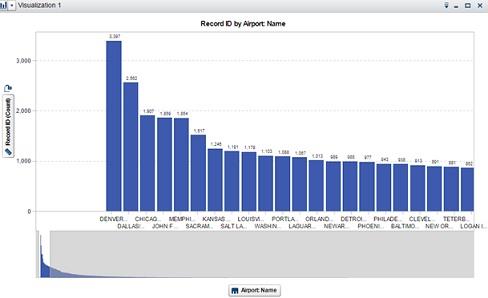
Question 15: Using the sum of the number of records, investigate the bird strike count by airport.
Answer:
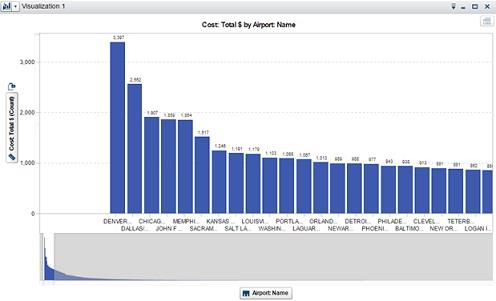
Question 16: Investigate the bird strike cost by airport. Hint: remove any missing data and use a sort on the cost.
Answer:
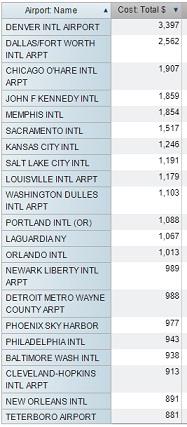
Question 17: Compare the answers of the two questions above. What does this indicate?
Answer: To compare question 15 and 16 we have look into visualization of the data as per questions are done. In both question we have shown the number of bird strike happen by different aircrafts.The largest number of bird species given in the data is horned lark, no of birds available is 588.And second largest species of birds is mourning dove with 491 bird's species available in the world. And the lowest no of birds available are three in wild turkey. In the system we have shown all the records as per the requirements.
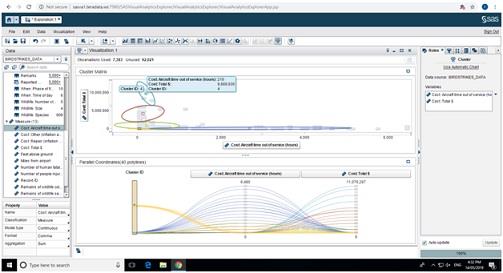
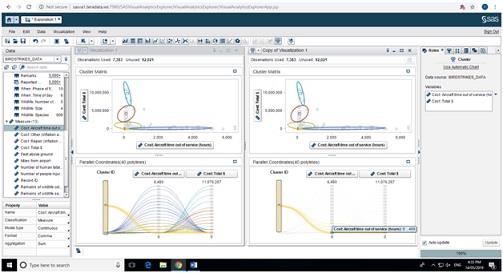
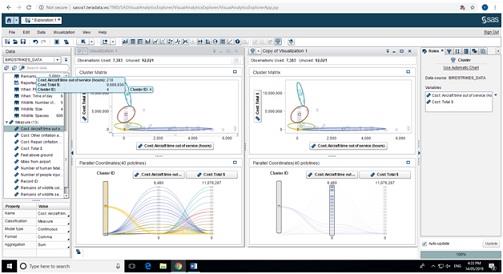
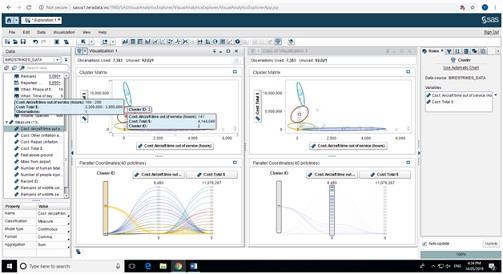
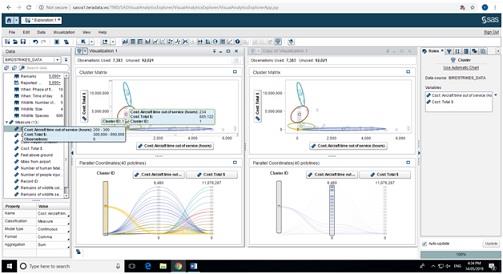
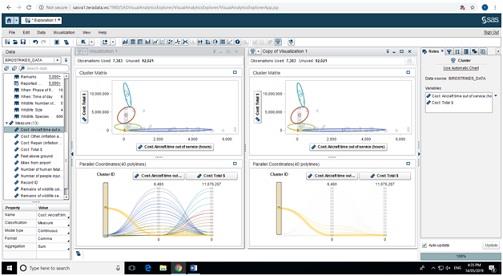
Question 18: Perform a cluster analysis on the two variables time out of service and total cost. Use the cluster matrix graph to describe how the four clusters differ from one another in terms of the two variables used.
Answer:
Task 3 - Additional Visualizations
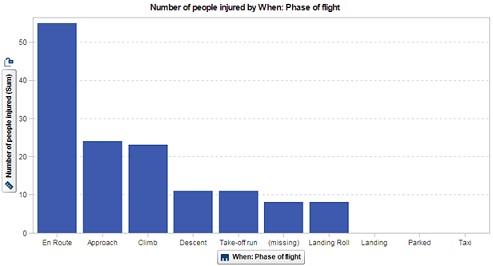
Answer: In this section we have done the visualization as we have done in the last part according to the need of the customer and organize every detail in proper format so that client could understand it easily. Psychologist and researchers have suggested that human brain has a high tendency to grasp the information if it is presented in the form of table, flow chart, and diagram or in the form of graphs as in here. It is relatively quiet easy to analyze and synthesize the report according to the need and requirement of the client when presented in the graphical format in an organize way. This data tells us the total fifty five people have injured during the en-route of the flight. And in the approach part of the flight, total number of injured people is twenty four. Accidents during traveling in taxi have occurred only once, lowest number of accidents during different phases of flight.
Total number of injured people during different phases of flight-
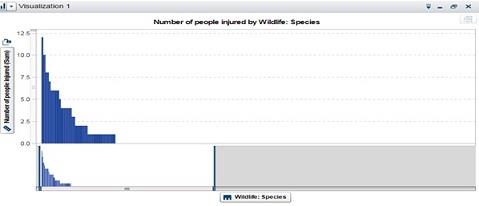
In the following visualization graph we have shown the people injured by the different species of the wild life. Highest number is 12 due to attack by the Turkey and the second number is the 10 people by unknown species and the lowest number of injured people is 1 by the franklin gull.
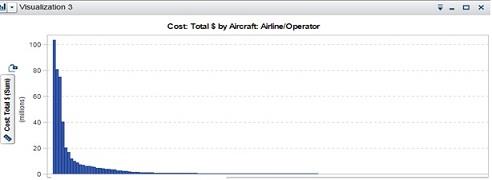
In the below graph of the visualization, we have represented the total cost of the plane which is collapsed during the flight because of the bird strike. Highest loss incurred was around the 103,565,746 and the lowest loss incurred was around $435,028 by the Colgan airways.
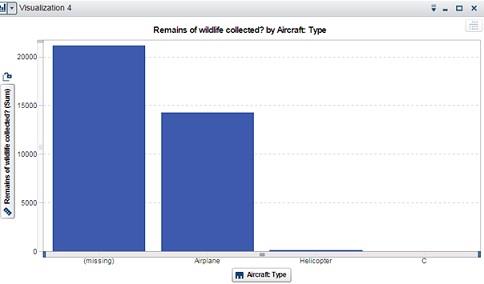
In the following graph of the visualization, we have represented the remains of the birds that are collected by the aircraft because of the bird collision. Highest number of remains of the bird collected by the aircraft is 21176 by an unknown airplane and in the second number is the 14277 remains and the lowest remains were collected by the helicopter that is 124.
GET READYMADE ITECH1103 BIG DATA AND ANALYTICS ASSIGNMENT SOLUTIONS - 100% PLAGIARISM FREE WORK DOCUMENT AT NOMINAL CHARGES!
Task 4 - Justification -Justify why these visualizations are chosen in Task 2 and 3.
Answer: Justification: For the visualization purpose, first we need to process out all the necessary information as required by the airlines, and then we can show the exact detail of the data through the graphs. This all data was collected by different sources then we have applied the big data analytics to process out only the relative and important information of the data. All the outcome result is presented in the forms of the graphs. The research paper that we have followed is based on the analytics of the big data. According to this research paper large sum of the data is created and to manage all these data we have to apply the different processes as the nature and type of the data is different. For the formatting of the data we use the different tool and we have mentioned all the tools in this report. For storing section of the required data we have used the cloud computing which is very suitable technique the data as we it saves the data in virtual memory and there is no need to store the data in physical memory. It saves lot of time and energy as we can access it from any part of the world and there is no risk of piracy of the data. For organizing and managing the data, which we get from big data analysis, we have used certain tools and software, which we have mentioned in this paper.
We have taken the help of the research paper to organize and analyze the data set according to the customer need. Customer primary requirement is to access all the necessary information in a quick way and for this purpose we have represented only the required information in the suitable graphical format with the help of the visualization technique.
Task 5 - Discussion of findings - using the visualizations created discuss the findings from the data set. and explain what each visualization shows.
Answer: As per the previous visualization we have shown all the details but numbers of people who are injured by bird strike by different birds species.The maximum numbers of people injured by turkey vulture bird species are twelve. In the record we have tried to show all the details of bird strike in different areas.
The visualization of these data shows the details of different species and keep the current records off all bird strike data. We have all the record of different aircraft who have attacked by different bird spices.
Task 6 - Executive Summary
Answer: As per the task done from the given data we have executed all the visualization process. By this task we have learned how to use visualization tool as per the process and the questions. The money spends for all these visualization .These data should be processed and all the requirement of the user should be covered. By this tool human task become easy and diagrammatic process data will become easy to understand.All these data are stored in large space and the storage cost is high .In the given data we have 4.95 M rows and 38 columns to analyze these data we need time.
Buy most affordable Federation University, Australia assignment help service for its related courses and units, such as:
- ITECH1004 - Introduction To Multimedia Assignment Help
- ITECH1005 - Business Information Systems Assignment Help
- ITECH1006 - Database Management Systems Assignment Help
- ITECH1100 - Understanding The Digital Revolution Assignment Help
- ITECH1101 - IT Problem Solving Assignment Help
- ITECH1102 - Networking And Security Assignment Help
- ITECH1104 - Cloud And Enterprise Computing Assignment Help
- ITECH1300 - Mobile Computing Platforms And Development Fundamentals Assignment Help
- ITECH1400 - Foundations Of Programming Assignment Help
- ITECH2000 - Mobile Development Fundamentals Assignment Help